At this stage in the holiday shipping season, demand for logistics services is continuing to grow in both retail and manufacturing sectors, but according to the recent results from the Logistics Managers Index (LMI), “firms cannot add logistics infrastructure quickly enough to keep up with burgeoning demand.”
The LMI is a diffusion index based on results from a survey of leading logistics professionals who are members of the Council of Supply Chain Management Professionals (CSCMP). The unique part of the LMI is the breakdown of warehousing into upstream (wholesalers, distributors and 3PLs) and downstream (customer-facing retailers) to gauge which part of the freight task is moving the most freight.
Being a diffusion index, any reading above 50% indicates that logistics is expanding; a reading below 50% is indicative of a shrinking logistics industry. According to Zac Rogers, Assistant Professor at Colorado State University, “the November reading of 70.8 released this week is the fifth highest-ever reading, with the LMI only being above 70 three times since the index began in November 2018, and those three months were the last three – September, October and November.”
Tune into DAT iQ Live, live on YouTube or LinkedIn, 10am ET every Tuesday.
Recent growth in logistics is being driven by firms reporting increasing levels of inventory, contracting capacity, and increasing levels of both utilization and price. “E-commerce is predicted to be up by 50% year-over-year in Q4, a sharp jump from the 13% increase that was predicted pre-pandemic,” according to Rogers.
From a carrier, shipper and broker perspective, e-commerce tends to be more logistics-intensive, which requires higher levels of inventory driving demand for more warehouse space and trucks to haul freight.
Much of the warehouse demand is coming from markets close to populations. “There is not enough warehouse space coming online to store goods close to consumers,” said Rogers, “which means everyone is looking for the same warehouses in more expensive urban areas”.
The LMI also reports transportation capacity, which is at 35 for November, down three points from last month’s reading of 38, but according to Rogers, “capacity is tightest for downstream customer-facing firms” involved primarily in the e-commerce retail sector. Looking ahead, LMI survey respondents expect downstream warehouse capacity to remain very tight for the next 12 months with the long-term shift to e-commerce expected to maintain demand for regional and short-haul carriers.
Dry Van

Much has been written about the unprecedented volume of online purchasing during the pandemic, but with an estimated 25% return rate in a normal year, shippers and retailers are bracing for, “the mother of all return seasons for heavy goods,” according to XPO Logistics President Erik Cladwell.
The big difference this return season, which typically runs between Thanksgiving and the end of January, will be the size of shipments being returned. According to reverse-logistics specialist goTRB, “the size of units returned is up 200% since the pandemic” along with a doubling in the weekly volume of returns.
Returns travel much the same way back to a warehouse as they were shipped initially, but with a massive increase in online orders of furniture and other bulky items, truckload volumes are expected to see much higher January return volumes than ever before.
Top 10 Market Watch
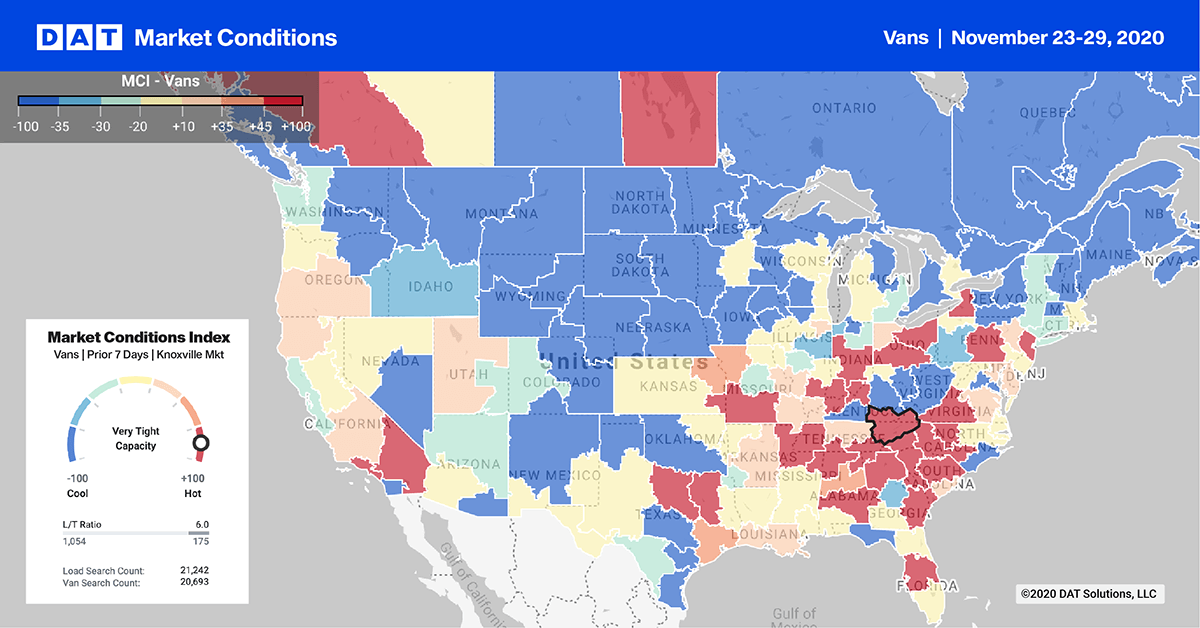
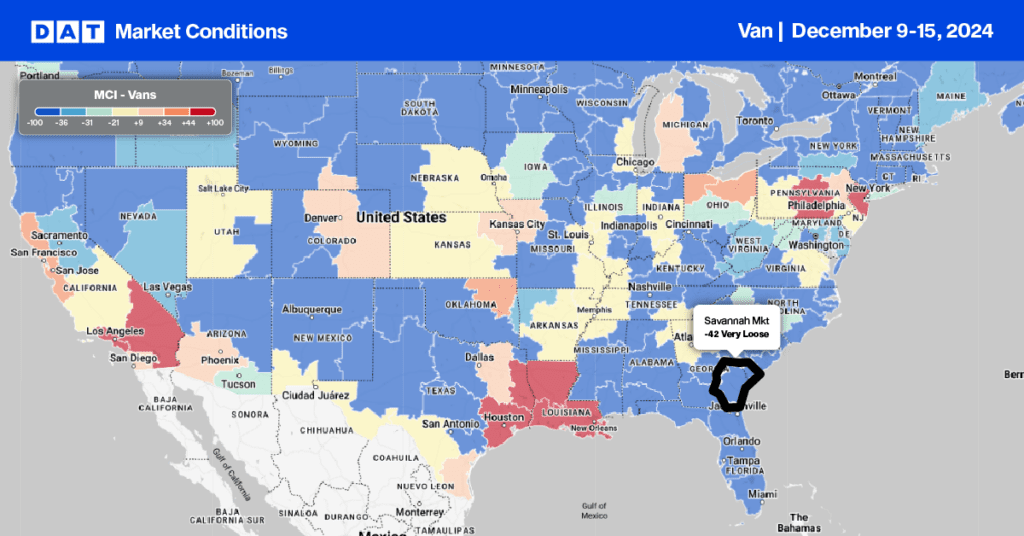
Outbound load volumes dropped last week in all of our top 10 freight markets – down a collective 24% w/w. Being a short shipping week, sharp drops in outbound volumes are to be expected, but large declines in Ontario (#4) and Los Angeles (#5) of 46% and 50% w/w respectively are notable.
These decreases are almost double the average decrease of other top 10 markets, yet capacity continues to tighten driving up rates again last week. In Los Angeles outbound rates increased by 6 cents to $3.21/mile last week and in nearby Ontario rates moved up 5 cents to $3.30/mile.
Reefer

For the week ending November 15, total demand for consumer packaged goods (CPG) was up 11% y/y, driven by strong sales growth in edible and fresh food departments, according to global consumer sales leader IRI.
Frozen beverages produced the strongest growth of any subcategory, with a 5% w/w increase to place this food category up 34% year-to-date. Seafood continued to lead the fresh foods department with volumes up 2% w/w and now up 13% since June 1 adding to the higher volume of temperature-controlled load volumes DAT has been recording in recent months.
Top 10 Market Watch
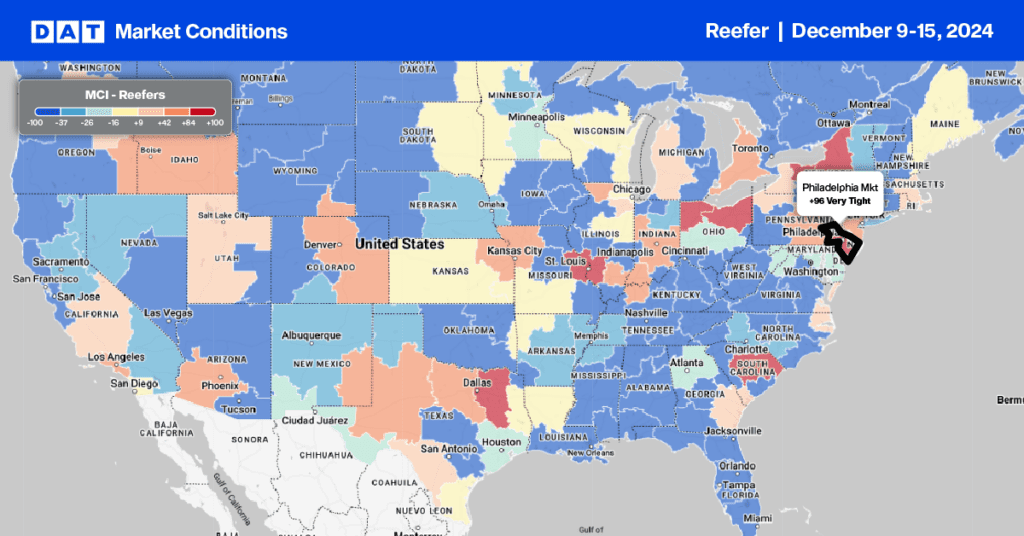
Similar to dry van, reefer volumes in all but one of the top 10 markets decreased this week. Late Fall produce volumes are starting to increase in the Lakeland, FL, market, where outbound volumes increased by 6% w/w as the first harvest of the strawberry season was reported by the USDA. Capacity in Lakeland was also tight last week forcing rates up by $0.18/mile to $1.61/mile with similar rates increases observed in Miami where rates increased by $0.16/mile to $1.66/mile.
Flatbed

Last week’s release of the October IHS Markit U.S. Manufacturing PMI provided some good news for flatbed carriers in the goods-producing sector. According to IHS, “manufacturing firms indicated the strongest improvement in operating conditions since September 2014”, in the first PMI survey post-election. Manufacturers reported a marked expansion in output as demand conditions continued to improve driving the index to a 74-month high.
Top 10 Market Watch
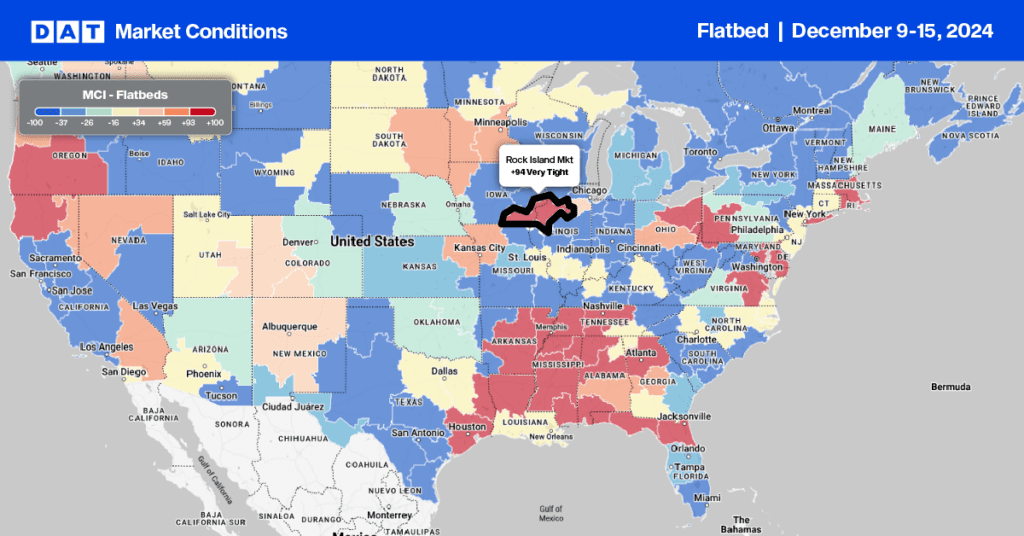
The flatbed market continues to cool the most of the three equipment types we track each week. Last week the top 10 markets dropped by a combined 39% w/w. Only four of the 135 markets we track weekly reported increases.


