Last summer, the spot market didn’t have enough trucks to meet the surge in demand, which gave rates a major boost. Now, we are seeing more traditional fluctuations on the market.
The threat of new tariffs, plus disappointing harvests due to adverse weather, have helped keep van rates in check this summer, but there are signs that this could be the bottom for truckload pricing. The increases and decreases on the Top 100 lanes were mostly balanced, and most changes in price were slight on a lane-by-lane basis. We could start to see demand and prices pick up steam again after Labor Day.

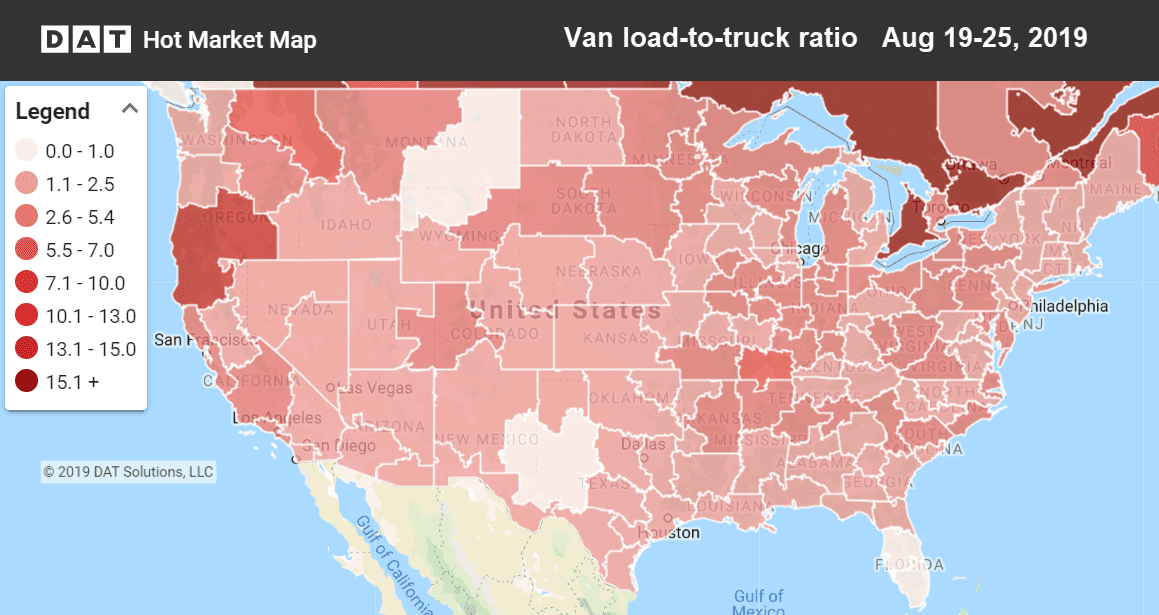
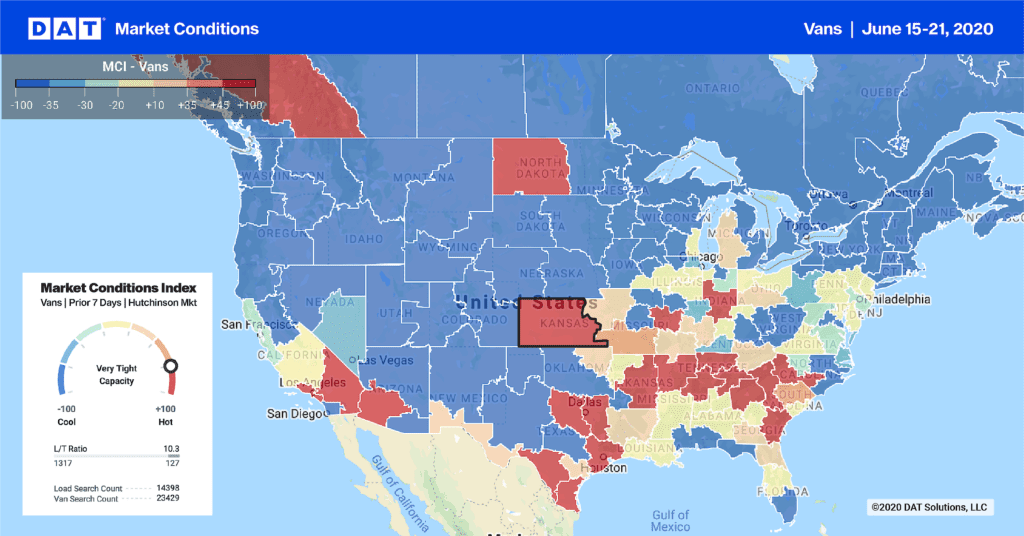
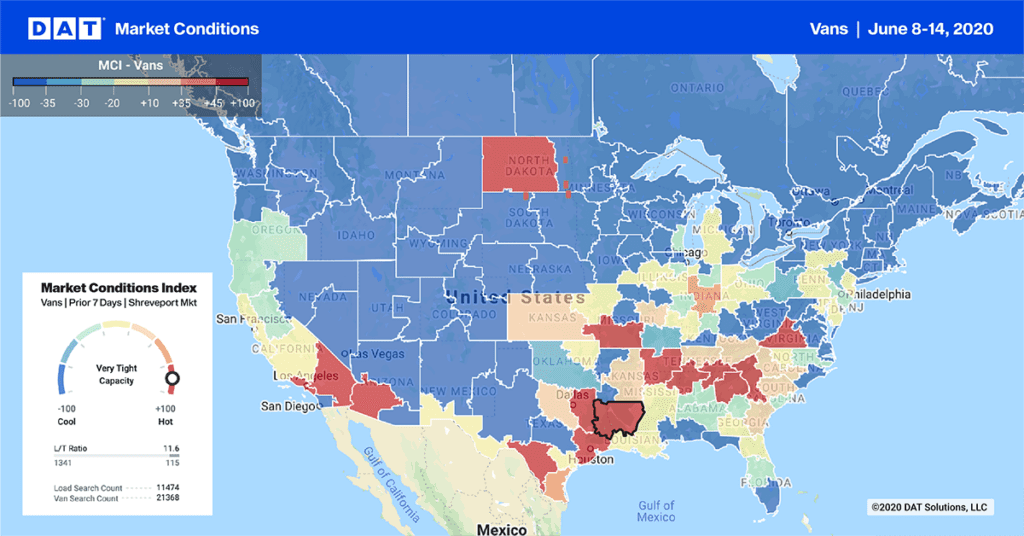
Hot Market Maps show the number of available trucks vs. available loads and are available in the DAT Power load board and DAT RateView.
Rising Lanes
Buffalo, NY, saw a big rise in volume last week, which kept rates up. Columbus, OH, also saw a notable spike in volume which resulted in rate increases in top lanes coming out of the area.
- Columbus to Buffalo climbed 13¢ to $2.82/mi
- Seattle to Spokane, WA, increased 12¢ to $3.06/mi
- Stockton, CA, to Denver also increased 12¢ to $2.16/mi
- Buffalo to Allentown, PA, was up 8¢ to $3.06/mi
Falling Lanes
While Columbus to Buffalo was the biggest gain last week, the most significant drop was on the return trip from Buffalo to Columbus, which highlights how the balanced markets largely kept prices stable last week..
- Buffalo to Columbus dropped 10¢ to $1.85/mi
- Philadelphia to Boston fell 9¢ to $3.45/mi


