After declining for several weeks, van rates seem to have turned a corner. The national average rate for May so far is $1.82/mi., which is above the April average. Individual lane rates are also trending upward. Last week on the top 100 van lanes 53 were up, 35 were down and 12 were neutral. It’s been six weeks since we’ve seen more rising lanes than falling. Spring has also brought increased demand: last week the van load-to-truck ratio rose 10%, after climbing 25% the week before.
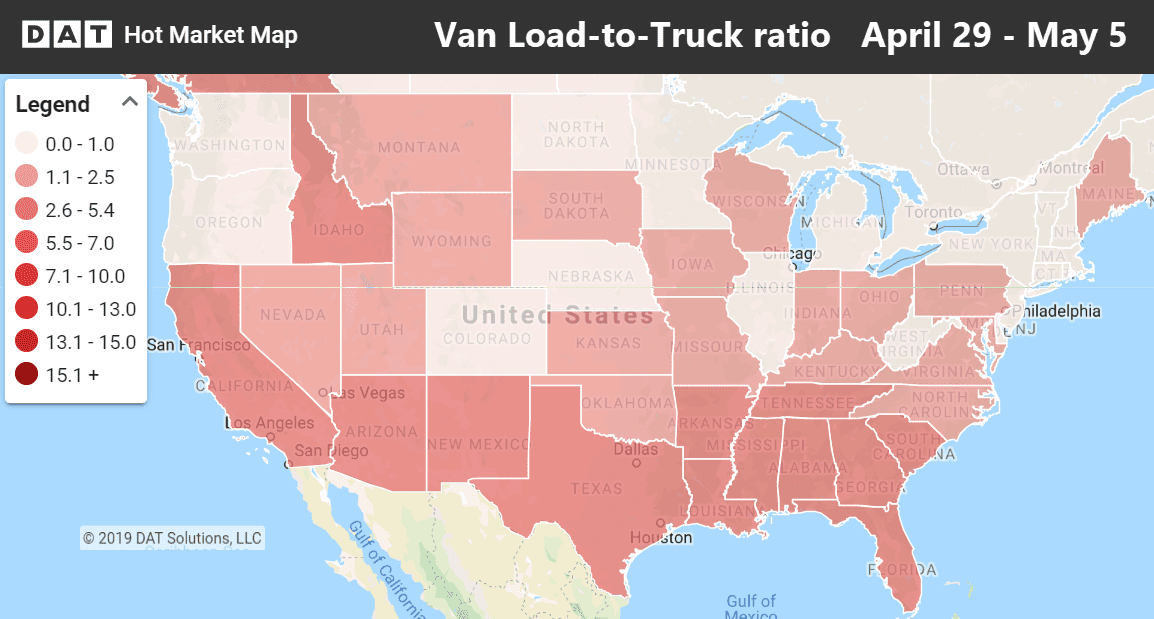
The national average load-to-truck ratio for vans moved up to 1.8 last week, with the greatest demand coming from the southern band of states. Darker colors on the Hot Market Map in DAT RateView and the DAT Power load board show areas where truck capacity is tightest.
Rising rates
We’re finally seeing the impact of better spring weather, with higher freight volumes coming out of both Chicago and Charlotte. A couple of lanes into Buffalo had decent rate increases, possibly reflecting increased demand for exports into Canada.
- Memphis to Indianapolis jumped 17¢ to $2.10/mi.
- Philadelphia to Buffalo rose 11¢ to $2.17/mi.
- Charlotte to Buffalo also rose 11¢ to $2.24/mi.
Falling rates
There were very few price drops of any significance last week.
- Allentown, PA to Richmond, VA dropped 10¢ to $2.09/mi.
- Chicago to Columbus dipped 8¢ to $2.39/mi.
- Memphis to Charlotte slid 7¢ to $1.95/mi.
Related: Reefer rates rise as Florida hits its stride
Find loads, trucks and lane-by-lane rate information in DAT load boards, including rates from DAT RateView.


