Last week the national average van rate dropped 4¢ to $1.97/mile. The last time the average van rate was below $2 per mile was 16 months ago, in September 2017.
There’s the normal seasonal slowdown that occurs around this time each year, but falling fuel surcharges and increased capacity in the spot market are adding to downward pressure on rates. We’ve seen the same trend play out for reefers and flatbeds.

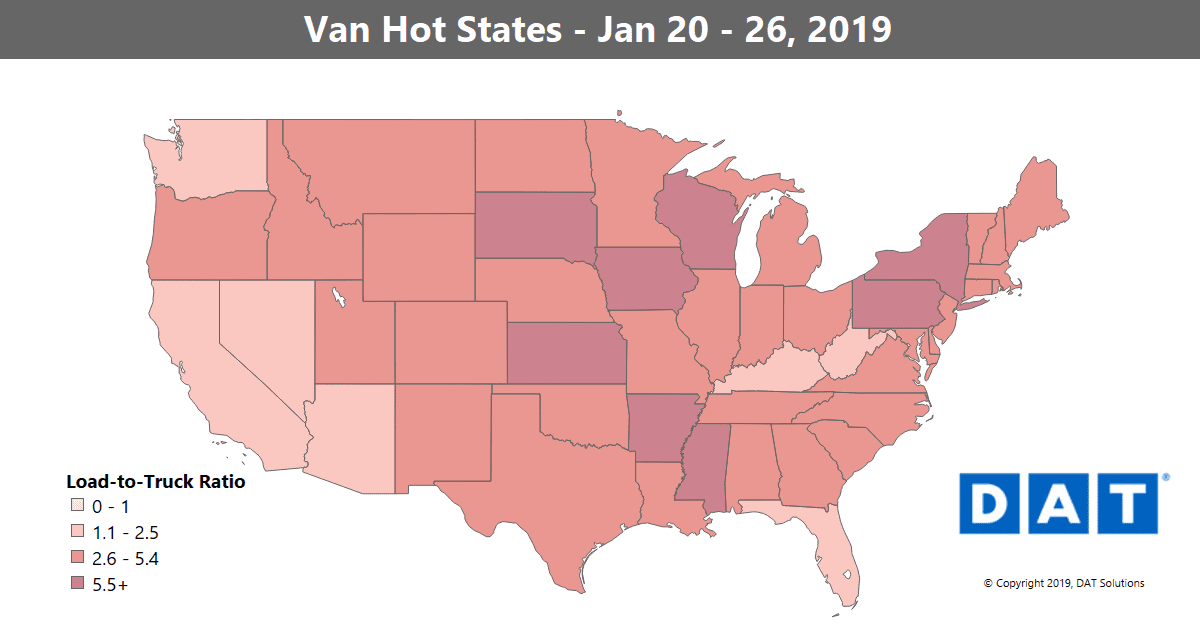
There weren’t too many hot markets last week and the national load-to-truck ratio was at 4.0 loads per truck. In the top 100 lanes, 68 lanes moved lower, 26 were higher and 6 stayed the same. But while spot rates continue to tumble from December levels, volumes are actually holding up pretty well this January.
(All rates below include fuel surcharges and are based on real transactions between brokers and carriers.)
RISING
While the Pacific Northwest can’t exactly be called a hot market – with its load-to-truck ratio just over 1 load per truck – it was good enough to boost rates almost 4% out of the region, which has enjoyed a mild winter so far. And rates out of Denver are holding up, for the second week in a row.
- Denver to Oklahoma City rates rose 13¢ to $1.34/mile.
- Philadelphia to Charlotte added 10¢ to $1.60/mile.
- Buffalo to Allentown bumped up 10¢ to $3.18/mile. That was one of the few lanes paying above $3 per mile, probably because of the crazy cold weather in Upstate New York.
FALLING
We’re seeing weakness in Chicago, Los Angeles, and much of the Southeast region:
- Chicago to Columbus fell 19¢ to $2.71/mile.
- Los Angeles to Chicago dropped 19¢ to just $1.30/mile.
- Memphis to Indianapolis dipped 16¢ to $2.01/mile.
- Atlanta to Philadelphia moved down 15¢ to below the $2 mark at $1.94/mile.
Find loads, trucks and lane-by-lane rate information in DAT load boards, including rates from DAT RateView.


