With Thanksgiving approaching, it’s the reefer segment that is driving seasonal demand, as grocery stores prepare for the big day. And with e-commerce season still building, we may soon see an increase in van demand and rates too.
National average rates
- Van $2.09/mile, unchanged
- Reefer $2.45/mile, up 4¢
- Flatbed $2.42/mile, down 2¢

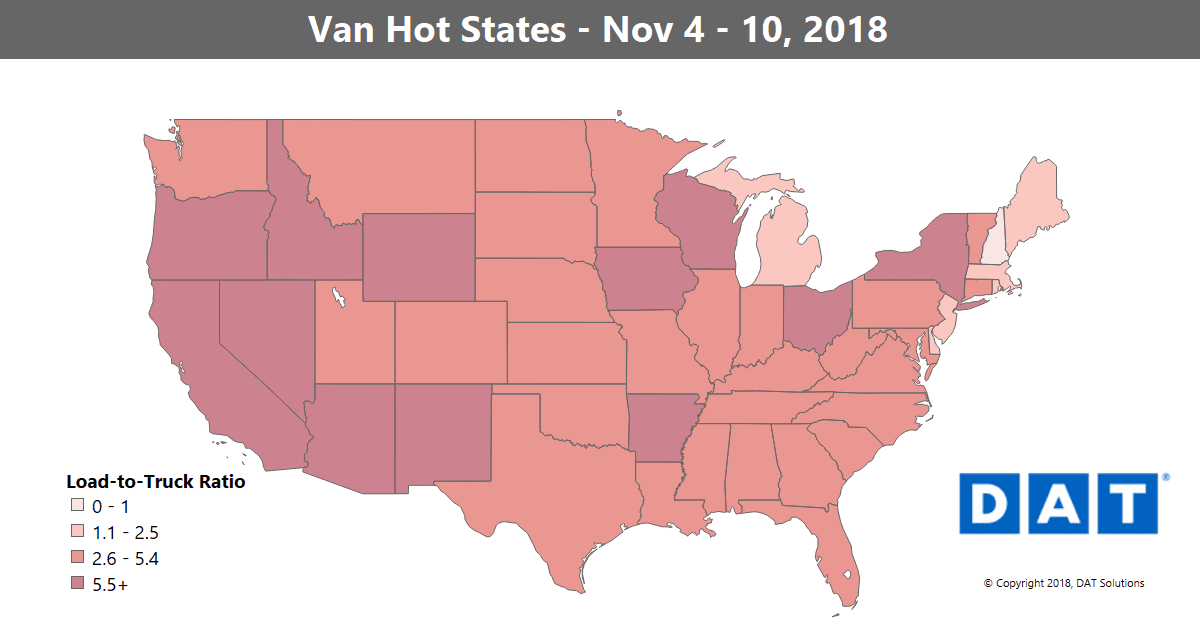
The load-to-truck ratio for vans declined 9% last week, to 4.7 loads per truck, after rising 10% the previous week. The map depicts outbound load-to-truck ratios by state, for dry van freight. The load-to-truck ratio is a sensitive, real-time indicator of the balance between demand and capacity. Changes in the ratio often signal impending changes in rates.
VAN TRENDS
There has been a strong freight surge moving from Los Angeles toward the East, which is causing higher outbound volumes in cities like Chicago, Columbus and Memphis. That caused more lane rates to rise than fall last week for the first time in several weeks.
Rising van markets
The main driver of demand continues to be the Los Angeles freight market. Rates out of L.A. averaged 4% higher last week and are about 8% higher over the past month. Other than a small bump from Seattle, L.A. is the only major van market in the U.S. with rising rates. Let’s look at some lanes:
- Los Angeles to Atlanta jumped 20¢ to $2.43/mile
- Los Angeles to Denver increased 19¢ to $3.40/mile
- Los Angeles to Phoenix added 14¢ to $3.56/mile
Falling van markets
Most markets were in rough equilibrium last week. Buffalo registered the largest decline, and that was less than 2%. Rates seem to be waffling a bit as an increase in loads is meeting plentiful supply of equipment.
- Boston to Allentown was down 14¢ to $2.04/mile
- Buffalo to Columbus dropped 12¢ to $2.09/mile
- Buffalo to Chicago slipped 11¢ to $1.71/mile
- Otherwise, most of the falling lanes saw only slight declines last week
REEFER TRENDS
Reefer freight is the only segment showing solid gains. Last week on the top 72 reefer lanes twice as many lanes had rates go up than go down. We’ve seen solid freight volumes coming out of California and most of the West, and even Central Florida. That has pushed prices higher.

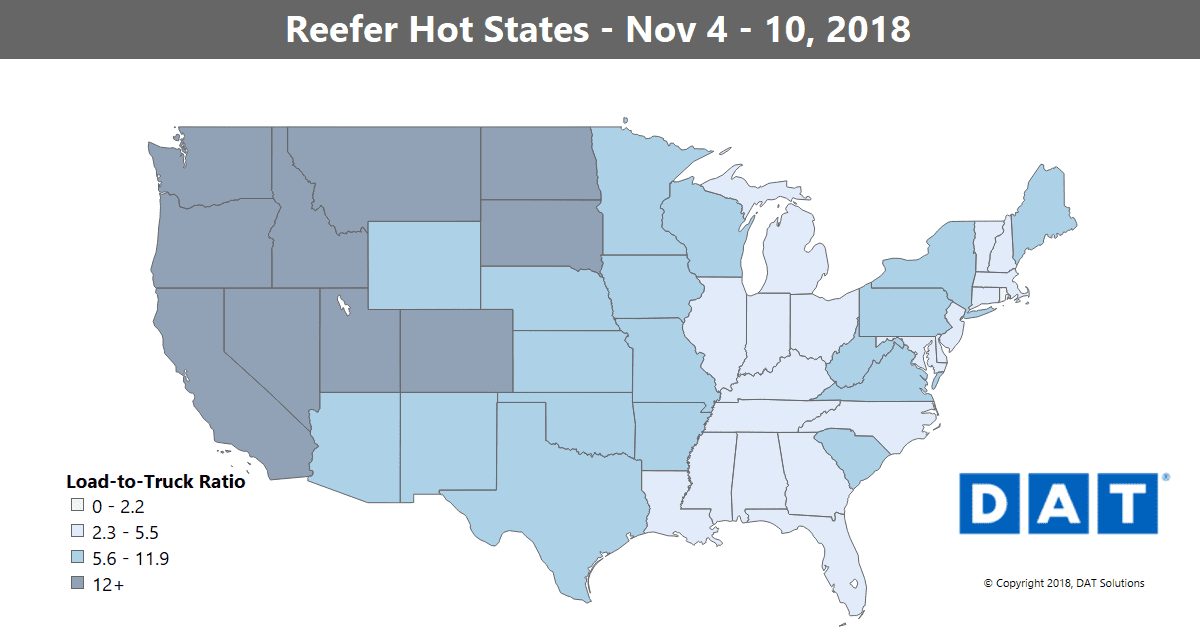
The load-to-truck ratio for reefers increased 4% last week, to 7.0 loads per truck. The map depicts outbound load-to-truck ratios by state, for refrigerated freight.
Rising reefer markets
Western produce picked up in nearly every market, led by gains in Twin Falls, ID and Fresno in Central California. Even Lakeland, FL had a bit of a bounce.
- The lane from Nogales to Dallas surged 41¢ to $2.59/mile, with avocados on the move
- Denver to Ontario, CA, jumped 40¢ to $1.69/mile
- Sacramento to Los Angeles gained 24¢ to $3.00/mile – that’s a strong southbound rate
- Fresno to Denver added 20¢ to hit $3.18/mile
Falling reefer markets
As freight picks up in the West, we’re seeing a slowdown in the Midwest, which is tempering prices.
- Apple season is winding down and the lane from Grand Rapids to Philadelphia fell 25¢ to $3.51/mile
- Sacramento to Portland, OR, dropped 19¢ to $3.08/mile, but outbound volume is growing in the Pacific Northwest
- Back East, Elizabeth, NJ, to Boston fell 12¢ to $4.19/mile, which sounds like a lot until you factor in the traffic and tolls
Find loads, trucks and lane-by-lane rate information in DAT load boards, including rates from DAT RateView.


