
After repeated periods of record growth from January through June, the weekly DAT Dry Van and Reefer Barometers have pulled back slightly, and appear to be entering a more stabilizing trend. Meanwhile the weekly DAT Flatbed Barometer has begun to pull back slightly in the past two weeks, after setting one new record high after another through the month of June. All three modes of truckload freight are reflecting an environment in which demand exceeds capacity by a wide margin.
What are the DAT Barometers? We worked with DAT data scientists to develop this set of barometers that measure the pressure of demand relative to truckload capacity in the spot market. If the market is in a state of equilibrium, the barometer value is 50. Anything above 50 indicates imbalance, where demand exceeds capacity, where a barometer reading of 55 indicates moderate pressure and a reading above 60 indicates stronger pressure. The higher the pressure, the more likely it is that spot market rates will rise, and that contract rates will follow.
Conversely, a barometer reading below 50 indicates that there is more than enough capacity to meet demand. As seen below, none of the three Freight Barometers has dropped below 50 in well over a year.

While all DAT Freight Barometer readings have been above 50 for more than 52 weeks, indicating expansion, the rate of that expansion accelerated in June and early July. The upward trend moderated and stabilized somewhat in mid-July, but all three Barometers still point to expansion in market pressure.
- Dry Van – The weekly barometer is predicting stronger contract pricing in the coming months. Even though it has pulled back slightly from extreme highs, the barometer continues to reflect one of the highest levels of demand in excess of capacity in recent years.
- Reefer – This barometer is also continuing to predict stronger contract reefer pricing in coming months. As with dry van, the reefer barometer has receded from the June peak, but it continues to reflect historically high levels of demand in excess of capacity.
- Flatbed – After moving ever higher and setting one record after another over the last six months, the flatbed barometer has pulled back very slightly for the last two weeks. Nevertheless, contract flatbed pricing is expected to continue at extraordinary levels.
Dry Van Barometer Supports Higher Contract Rate Expectations
Week Ending June 14 – After breaking above 50 (equilibrium) 13 months ago, the weekly Dry Van Barometer has continued to climb. Although the current reading of 59.9 is not quite at the extreme levels of capacity tightness (above 65.0) of late January and early February, there are still far more loads than trucks in most lanes and regions. The Barometer’s highest level for this recovery came early this year, in a seasonally weak period for demand, as February is typically the weakest freight month of the year. The Barometer then began to drift down as truckers (mostly small fleets and owner operators) who had just recently adopted ELDs adjusted to using the devices. More recently, the Barometer has begun to rise again as demand is growing faster than capacity. The Barometer’s current level should bode well for carriers seeking higher contract pricing in the second half of 2018.
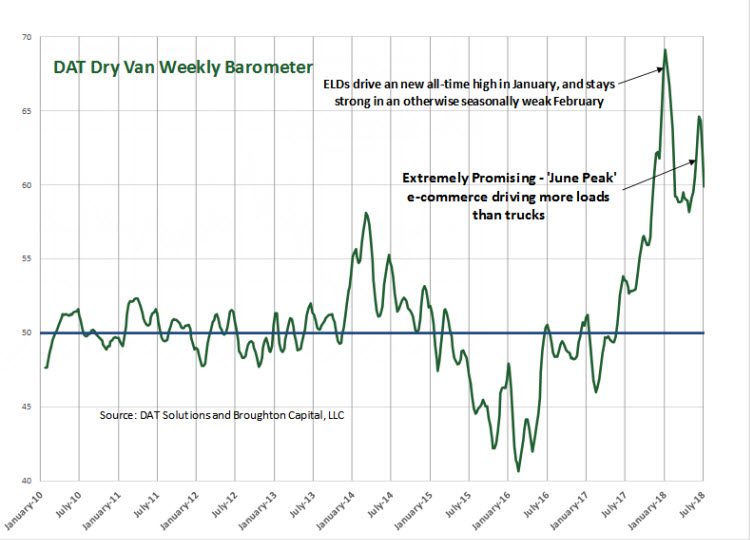
Despite a slight downturn, the weekly Dry Van Barometer reading of 59.9 continues to indicate a strong pricing environment for carriers.
Dry Van Barometer Predicts Spot Rate Increase
As a reminder, this Barometer is extremely effective at predicting rate trends. In past years, pricing trends might have lagged the Barometer by a month or two, but now the changes are nearly concurrent. The Barometer rises, and rates respond immediately. Here is an illustration, with the Monthly Dry Van Barometer for June overlaid on the monthly national average rate for vans on the spot market. The trends have matched almost exactly since January 2017.
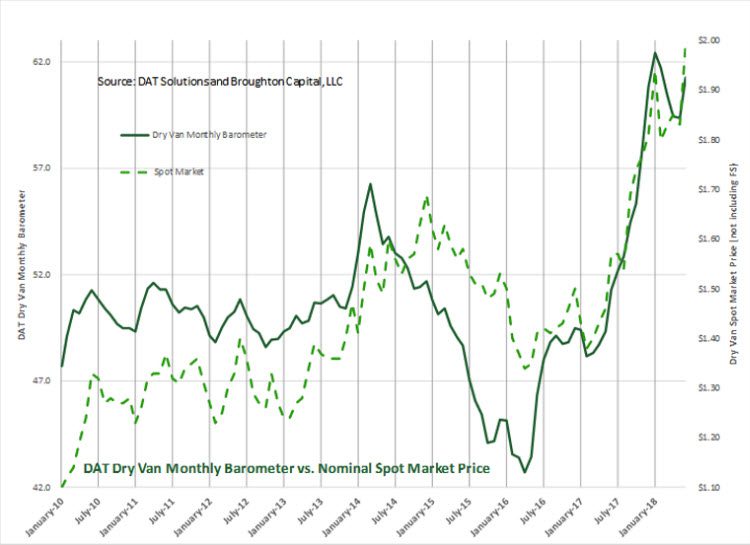
DAT Freight Barometers are a reliable indicator of spot market rate trends.
When Spot Market Rates Rise, So Do Contract Rates
“Yes,” you say, “It’s all well and good, but this is all spot market data. What about contract rates?”
Here’s the answer to that question, in one more graph. Spot market rates started rising in Q1 2017. The same market pressures drove contract rates up, too, but much more gradually. The graph below depicts the line haul portion of both rates, exclusive of fuel surcharges.
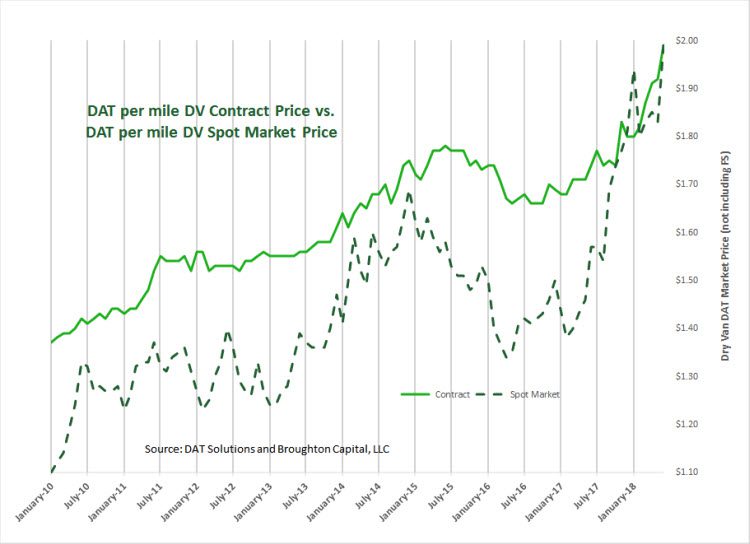
Sustained changes in dry van spot market rates anticipate changes in contract rates.
Reefer Barometer Edges Down, but Stays Unseasonably High
Week Ending June 14 – At 61.3, the Reefer Barometer has been well above 50 (equilibrium) for the fifty-fifth week in a row. As with the Dry Van Barometer, the current reading for reefer is not at the extreme levels of capacity tightness measured at 65.0 in late January and early February, but there are still far more loads than trucks in most lanes and regions. Also like the van segment, late adopters of ELDs in the reefer segment are beginning to regain some of the productivity that they initially lost, but unlike the Dry Van segment of trucking have fewer choices in managing the use of the trailer. Dry Vans are easy to ‘drop and hook.’ Whereas, Reefer tends to need at least some basic level of driver involvement, and Reefer fleets tend to carry much lower trailer to tractor ratios (averaging 1.5 to 1) than do Dry Van fleets (averaging 2.5 to 1). That said, the current level of DAT Reefer Weekly Barometer is predicting stronger contract pricing in coming months.
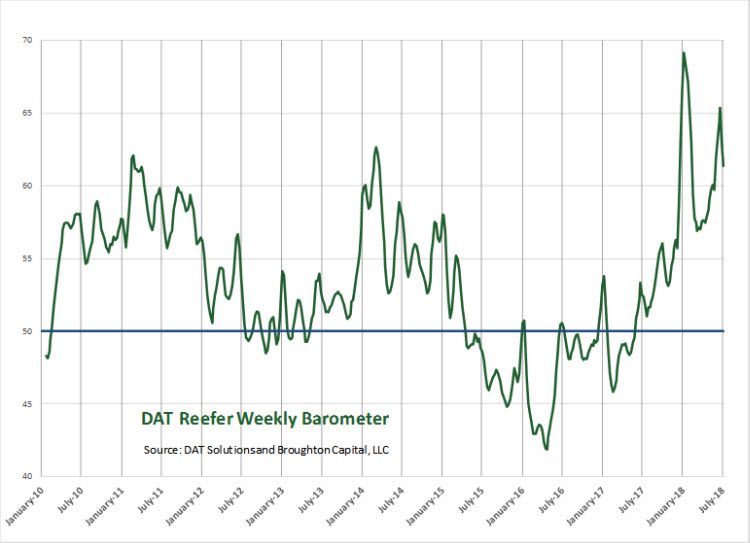
Despite a seasonal decline that is typical for July, the weekly Reefer Barometer reading of 61.3 continues to signal tight capacity and elevated pricing.
Flatbed Barometer Pulls Back From Record Highs
Week Ending July 14 – The Flatbed Barometer came in at 87.6 last week, which is a big drop from the zenith record high of 115.9 in the first week of June. The metric originally broke through 50 (equilibrium) in March 2017, as the price of crude rose above $50 a barrel (above $67 this week) and drove an increase in heavy industrial activity, especially in the energy sector. We see the current level of flatbed activity as evidence that the U.S. industrial economy has shifted into high gear.
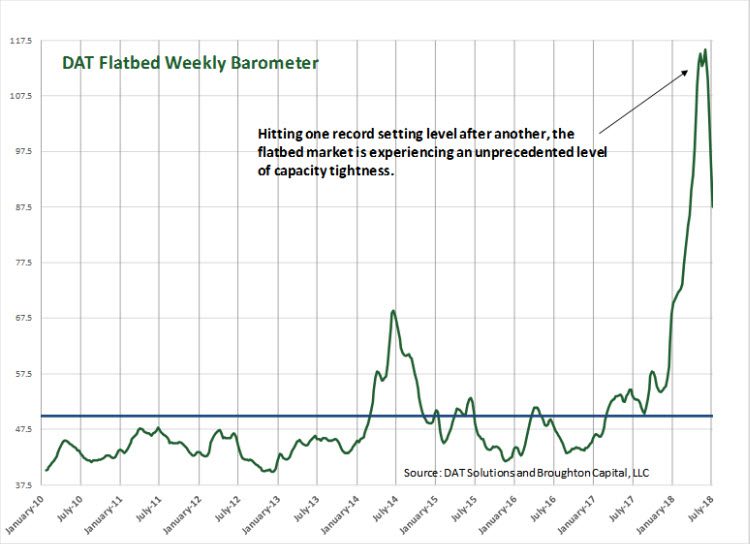
Flatbed Barometer levels are coming back to earth, but increased industrial activity, driven by higher oil prices, still generates atypically high demand and extreme capacity imbalances in this segment.
Donald Broughton, Managing Partner of Broughton Capital, is a financial analyst with decades of experience in the transportation industry. DAT Freight Barometers are published by Broughton Capital, based on data from DAT load boards.

