Spot market freight veterans know that by mid-January we start to see freight volumes and rates trending down as the urgency of the holidays—even the most recent ones extended by e-commerce—wanes. 2017 is no exception, although this year we’re climbing down from a higher starting point.
If you took a look at DAT’s Hot States Map for Vans at the end of December, 20 of the lower 48 states were bright red, indicating that there were at least 5.5 loads for every available truck, and another 20 were showing anywhere from 2.6 to 5.5 van loads for every truck. Not too shabby for the week after Christmas.

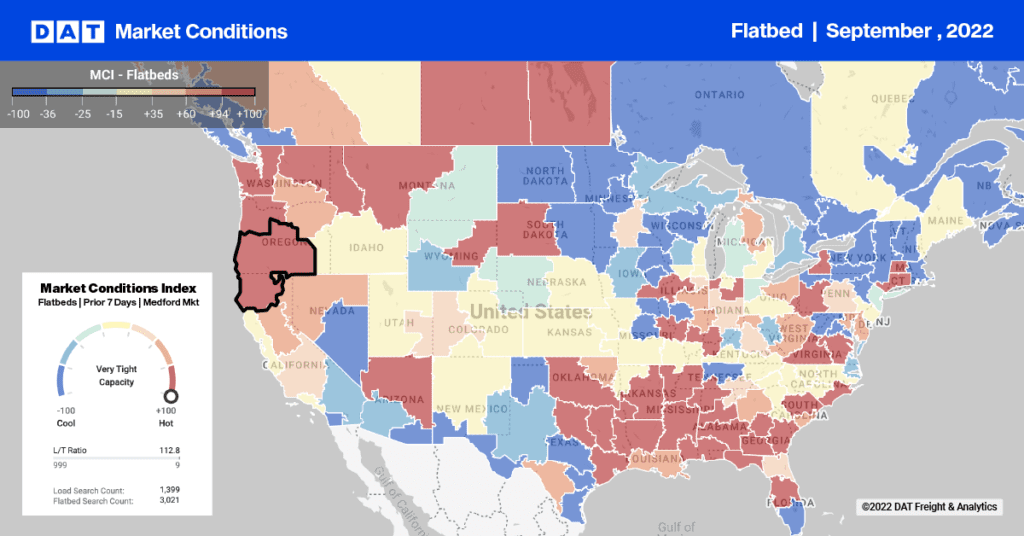
This Hot States Map from DAT RateView depicts the load-to-truck ratio in each state on Wednesday, December 28th. Higher demand for vans drove load-to-truck ratios up throughout most of North America in the week after Christmas.
January Ends Strong
The 2017 January DAT Freight Index (shown below) closed at a high not seen since January 2014 or January 2015. The year 2014 was the year of the Polar Vortex—the so-called “Snowpocalypse”—which, coupled with new hours of service rules, helped set records for freight and rates on the DAT freight exchange. 2015 was the second highest year for freight and rates following 2014, although it came down precipitously after July highs, following typical seasonal trends.

The point of covering this recent freight and rate history, is that as we enter the second week in February this year, we are seeing typical slowdowns in freight and rates, although they’re coming down from weekly and monthly highs not seen for a couple of years. For example, the January 2017 van load to truck ratio was up 76% year over year, reefer was up 62% and flatbeds up 164% over the same time period.
Rates Up Slightly Year Over Year
However, in that same year-over-year period, spot rates for vans were only up 1.3%, reefers were up 3.2% and flats were up just 1.6%. Part of the answer lies in the fact that contract carriers put a significant number of trucks on the spot market in January, depressing rates. This becomes even more interesting when looking at the recent financials announced by some publicly traded carriers showing that in 2016 they took a beat-down on rates in the middle of the year, as shippers took advantage of a capacity “glut.”
That no longer seems to be the case, as contract rates have flattened out, and there’s roughly a quarter difference separating spot and contract linehaul, which suggests that if the economy continues to show even modest improvement and the energy sector picks up—the Baker Hughes report shows that fracking is picking up the pace in 2017—there’s good money to be made on the spot market.
Stay tuned.


