We look at national trends every week, but sometimes the detail can get lost. Then we look at lane-by-lane reports, and we might miss a broader trend. I decided to look at last week’s rate trends by region. I looked at 15 regions, and compared the rates for the past seven days to the rates for the previous 90 days — that’s the first week in November compared to the entire third quarter. (Note: DAT RateView subscribers can duplicate these results, by running two views of the data, one for seven days and one for the previous 90 days, and then comparing them in a third spreadsheet.)
Comparing the outbound rates from 15 regions to each of the same 15 regions as destinations, gives you 225 (15 x 15) origin-destination pairs. In the first week of November, 64 of those region-to-region pairs had a rate increase of at least 6¢ per mile, and the biggest increases were on lanes that originated in the West, heading to destinations along the East Coast.
Here are the four region-to-region pairs with the biggest rate increases, comparing last week to the third quarter averages:
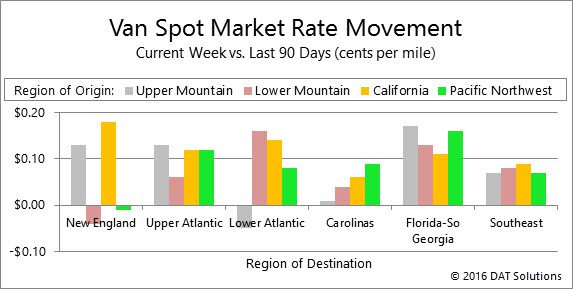
1. California to New England – up 18¢ per mile
2. Upper Mountain States to Florida and Southern Georgia – up 17¢ per mile
3. Pacific Northwest to Florida and Southern Georgia – up 16¢ per mile
4. Lower Mountain States to Lower Atlantic States – up 16¢ per mile

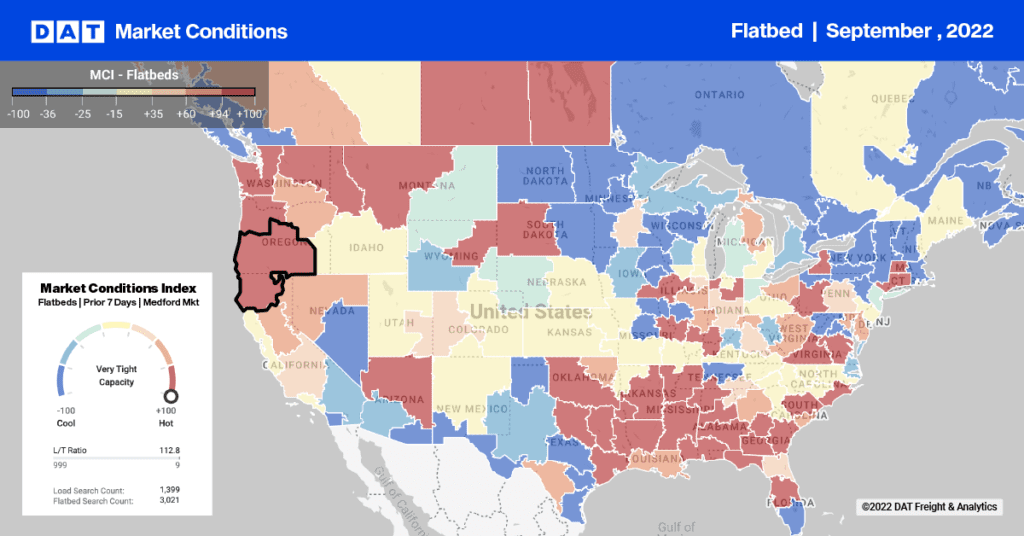
Rates have been climbing on many west-to-east lanes throughout the fall season. In nearly every case, rates are up by 6¢ per mile or more. On a region-to-region basis, the biggest rate jumps, of 16¢ to 18¢ per mile, are depicted on the map, above. From top left: (1) Upper Mountain to Florida-South Georgia; (2) Pacific Northwest to Florida-South Georgia; (3) California to New England; and, (4) Lower Mountain to Lower Atlantic.

The graph shows 24 region-to-region pairs, with changes in rates for freight movements that originated in four Western regions, labeled by color: Upper Mountain, Lower Mountain, California, and Pacific Northwest. The destinations are in six East Coast regions, listed on the X axis: New England, Upper Atlantic, Lower Atlantic, Carolinas, Florida-South Georgia, and Southeast. Of the 24 region-to-region pairs, only three had declining rates during the first week of November: (1) Lower Mountain to New England; (2) Pacific Northwest to New England; and (3) Upper Mountain to Lower Atlantic.
These results are atypical, so they may surprise longtime freight trend watchers. In recent years, fall freight has peaked in September and October. But in 2016, those patterns don’t seem to apply. For example, there is usually a peak for van freight in June on the spot market, followed by declining activity after the Fourth of July. That peak was muted this year, but so was the decline. Now we are starting November with no sign of a seasonal decline in activity. Instead, the freight economy appears to be heating up, at least on the spot market.
There is a clear trend of west-to-east movement, with increased activity in California, the Pacific Northwest and Mountain regions adding to rate pressure in other U.S. regions. Rates are also rising on seasonal traffic from Canada to the U.S., but rates are falling on lanes entering Canada from all over the U.S., except the Lower Mountain region.
If you are moving freight in the eastern half of the U.S., you may not be seeing much rate movement. In some regions, including the Great Lakes and Upper Midwest, rates were actually down 6¢ per mile or more last week. The strength of those west-to-east lanes has led the overall rate trend, however, and that trajectory has been up solidly for the past several months.
Measured at the national level for trips over 250 miles, spot market van rates are up 8¢ per mile in November, compared to the October average. Rates are up 23¢ per mile since the low point in April, including a 6¢ increase in the fuel surcharge.
We have seen this trend building for a while in the DAT RateView and load board data, and we identified a few factors that are contributing to higher rates:
1. Strong produce harvests, with declines in California being offset by strong numbers elsewhere.
2. Hanjin bankruptcy, resulting in supply chain disruption and increased amounts of inventory transfers, to prevent stock-outs.
3. Weather events, including flooding in Louisiana and the Carolinas, which generate demand for emergency relief, followed by construction supplies and equipment.
4. Some economic improvement, as indicated in recent ISM and other reports.
Refrigerated freight is showing renewed strength, as strong harvests give way to a pre-Thanksgiving surge. The national average rate rose to $1.97 per mile for reefers last week, the highest since early July. Strong potato harvests in southern Idaho, as well as apples from Washington and Michigan, add to a respectable volume of iceberg lettuce from the San Joaquin Valley and the Imperial Valley near Yuma, AZ. California continues to produce strawberries from Santa Maria to Watsonville, as well as a good crop of grapes. Add poultry, dairy products, and refrigerated packaged foods to the mix for Thanksgiving, and demand for reefers should keep
Flatbed freight also shows signs of stability, after a prolonged decline.
The regional views tell us that freight is remarkably strong for this time of year. While the geographic trends may shift in the next four to six weeks, it is reasonable to expect a continuation of the atypically high volume and rates on the spot freight market through the end of the year.
Track changes in spot market freight rates with DAT RateView, which offers real-time spot market and current contract rates, based on more than $28 billion in actual transactions.


