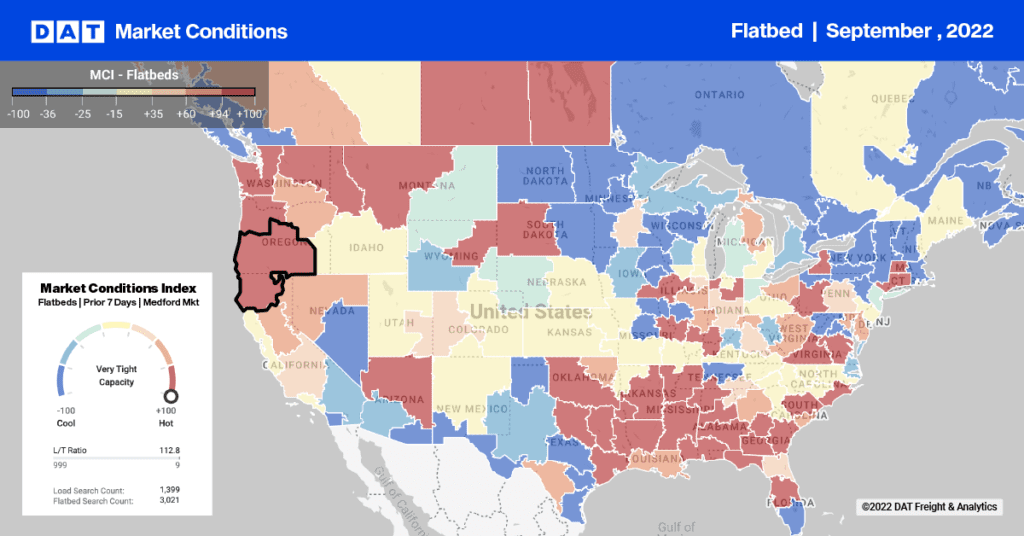
Reefer volumes were mostly in a holding pattern to close the month, similar to the last full week of October for vans. But there was much more regional movement with refrigerated freight, which is evidence of a pre-Thanksgiving push.
 Darker-colored states have higher load-to-truck ratios, meaning that there’s less competition for reefer loads in those states.
The Mexican border market of Nogales, AZ, has come back strong in the past month. The rest of the state’s load-to-truck ratio remained low, which you can see in the map above. Ontario, CA, rates have also been trending up, helped by strong van movement in Southern California. Harvests in the Upper Midwest are wrapping up, with Grand Rapids starting to fade, but Wisconsin is still strong for reefer loads. Strong inbound volumes to northern New Jersey drove prices down out of Elizabeth, NJ.
Lane-by-lane rate information and Hot Market Maps are available in the DAT Power load board. Rates are based on DAT RateView, with $28 billion in lane rates, updated daily, for 65,000 point-to-point lanes across North America.


