Rates moved in the opposite direction from load-to-truck ratios last week. Van and reefer rates declined while load volume and ratios for those equipment types increased. For flatbeds, rates rose while volume and ratio declined.
Typically, these trends go together: demand goes up and rates follow. So what is going on?
It could be a timing issue. Rates usually drop in July, but last month rates continued to climb until after Independence Day, before dropping gradually. So the usual July slump in rates carried over into the first week of August, even as load volume started to pick up again. Rates should turn around soon, if seasonal patterns repeat this year.
FREIGHT RATES
 Along with our standalone freight rates tool DAT RateView, all DAT load board packages include broker spot market rates on the lanes you’re searching.
A regional transition is in progress. The economy seems relatively stable, even though some types of manufacturing are lagging now. The focus is shifting northward for vans and reefers, however, so the increased freight availability could show up in regions and markets that were not as active in the summer.
Fuel prices fell in recent weeks, too, adding to downward pressure on rates because load providers — especially shippers — are accustomed to thinking of the fuel surcharge as separate from the line haul rate. Even though spot market rates are typically quoted “all in” as dollars per trip or per mile, fuel prices are changing the surcharge in the background, and the load providers take it into account.
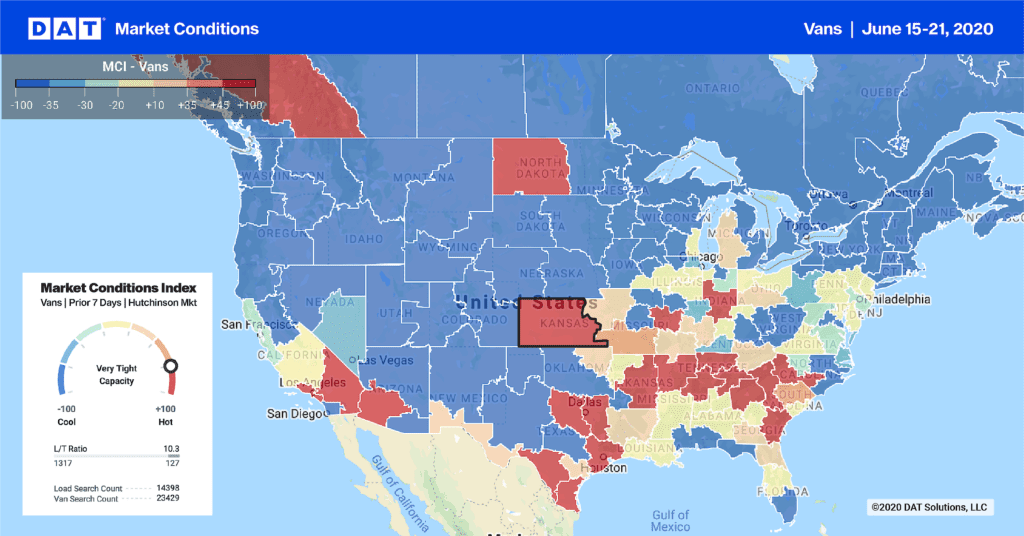
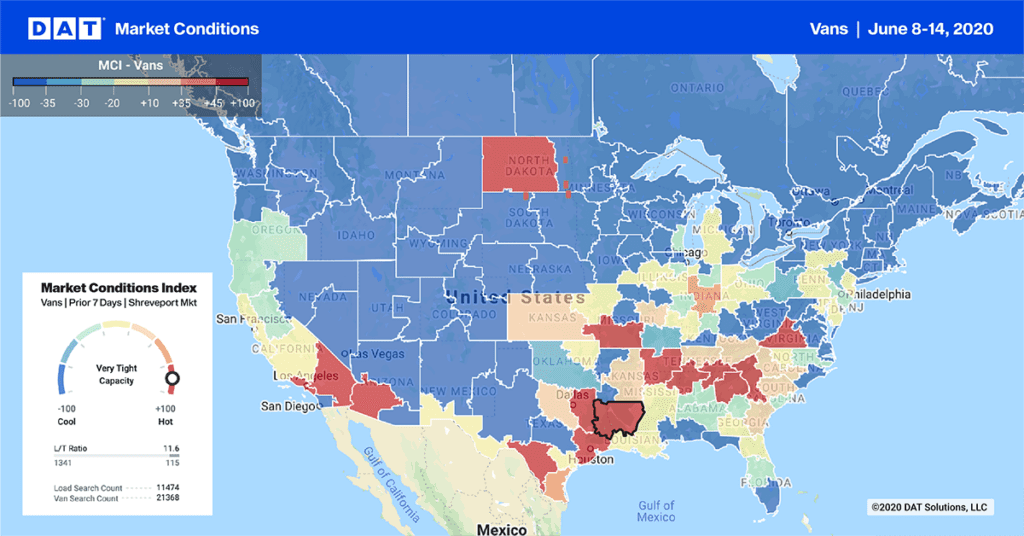
Here are three load-to-truck ratio “Hot States” maps from last week. The darkest-colored areas have more capacity pressure, with an above-average number of loads per available truck.
 5% more van loads were posted last week, and the load-to-truck ratio heated up in the Northeast and parts of the Midwest, as shown in this Hot States Map for the week of August 2 – 8, 2015. Spot market van rates dropped, however, due mostly to a decline in the fuel surcharge. (The price of diesel has been falling since mid-July, but the most recent decline triggered a change in the national average surcharge.) On the upside, rates rose last week in individual freight markets, including Philadelphia, Buffalo, Chicago and Charlotte. Darker red areas indicate statewide load-to-truck ratios that are well above the week’s national average, which rose to 1.9 loads per truck on DAT Load Boards. Daily maps, along with detailed information on demand, capacity and rates for individual markets and lanes, can be found in DAT Power Load Boards and in DAT RateView.
 Load volume increased 8.5% for reefers last week, but reefer rates lost another 8¢ per mile, as a national average. This was partly due to a decline in the average fuel surcharge, but average rates are also down because of sub-par harvests in California. Rates trended up last week in the Northeast and Midwest, where early crops are heading to market and grocery chains are stocking up on perishable items for the back-to-school season ahead. Outbound rates rose in a handful of markets, including: Twin Falls, ID; Chicago, Green Bay, WI; and Elizabeth, NJ. Rates are derived from DAT RateView, and are based on actual rate agreements between freight brokers and carriers. Reference rates include fuel surcharges but not accessorial or other fees. A map of reefer rates in key regional markets can also be found on DAT Trendlines.
 Flatbed load availability dipped 2% last week, but the national average rate increased by 2¢ per mile on the spot market, despite a decline in the fuel surcharge. Rates trended up in Houston, a major flatbed market, as well as secondary markets including Las Vegas, NV; Fort Worth, TX; Cleveland, OH; and Tampa, FL. Rates are derived from DAT RateView, and are based on actual rate agreements between freight brokers and carriers. Reference rates include fuel surcharges but not accessorial or other fees. A map of flatbed rates in key regional markets can also be found on DAT Trendlines.


