For flatbed carriers looking to gauge future demand in the building and construction industry, the Home Builders Housing Market Index (HMI) is based on a monthly survey of the National Association of Home Builders members, designed to take the pulse of the single-family housing market. The survey asks respondents to rate market conditions for the sale of new homes at the present time and in the next six months as well as the traffic of prospective buyers of new homes.
After peaking in October 2020, the HMI dropped for the third month in succession. The January point was down 4% month over month, impacted largely by a 2% m/m decrease in single-family home sales and a 7% m/m decrease in traffic of prospective buyers.
Regionally, the Northeast suffered the largest decrease, down 15% m/m. In the Southeast, where around 50% of new single-family homes are constructed, the monthly index dropped 6% m/m.
The Census Bureau reported that single-family housing starts, the largest share of the housing market, jumped 12.0% in December compared to November and was up 28% y/y. Building permits, an indicator of future construction demand, followed a similar trend, up 8% m/m and 30% y/y.
For flatbed carriers and even dry van carriers involved in hauling home furnishings, the housing market has been a star performer in the economic recovery, but the relentless COVID-19 pandemic is impacting the supply of labor at construction sites. The NAHB also reported that there has been “a dip in confidence among single-family homebuilders in January.” Builders complained about “supply-side constraints related to lumber and other material costs, a lack of affordable lots and labor shortages that delay delivery times and put upward pressure on home prices.”

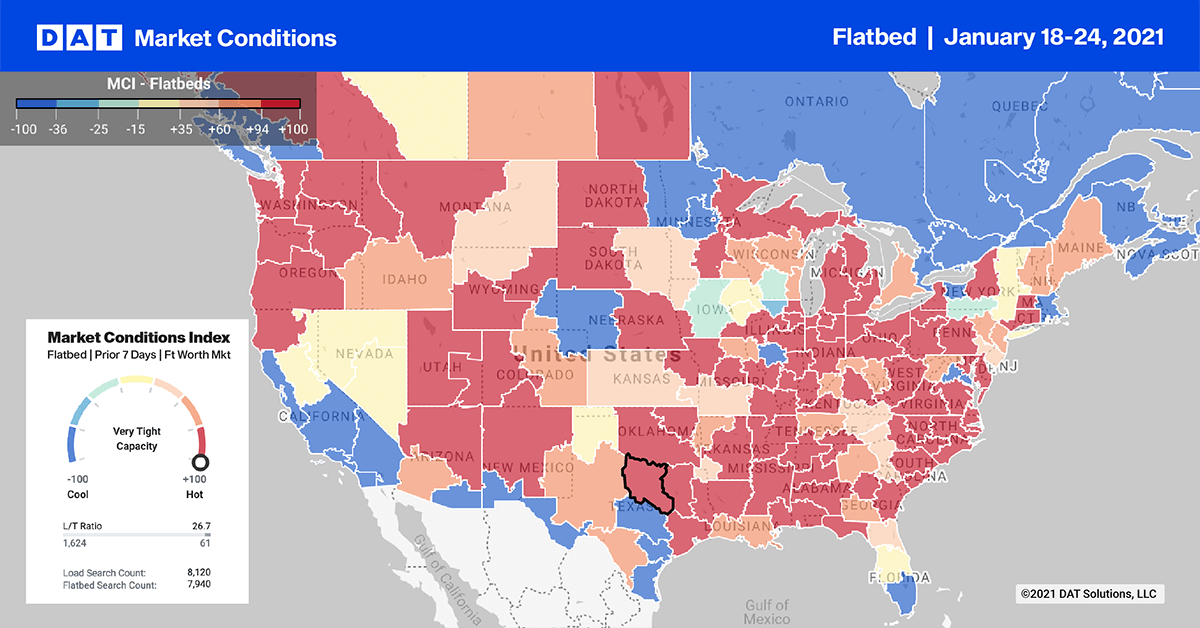
Load posts for the top 10 flatbed markets decreased by 2% last week as shippers continued to take advantage of the above average temperatures, especially in the northeast, where the last snowfall was eight weeks ago.
Memphis was again the number one market for outbound load posts, increasing by just under 19% w/w, which drove up spot rates by $0.05/mile to $2.87/mile (excluding fuel). Little Rock, AR, recorded a 21% w/w decrease in volume, with available capacity loosening and rates dropping by $0.10/mile to $2.40/mile.
In the Rapid City, SD, market, volumes dropped by 15% w/w, with capacity easing and rates dropping to $1.99/mile on average. Prices were much higher on lanes to Omaha and Fort Worth, TX.
Omaha jumped into the top 10 last week following a 54% w/w increase in outbound load post volume, but there was plenty of capacity as rates dropped $0.29/mile on average to $1.95/mile. Rates on the Omaha-Detroit lane were paying $2.26/mile on average, with some loads as high as $2.66/mile. Capacity was much tighter for loads to the south to Fort Worth, with 3-day averages at $2.43/mile and as high as $3.23/mile for some loads.
Spot rates
Flatbed spot rates shifted down slightly last week, decreasing by just $0.01/mile ending the week at $2.19/mile excluding FSC. They continue to plateau around this level and have been trading in the $2.17/mile to $2.22/mile band since early October.
Compared to the same week in 2020, flatbed rates were $0.40/mile higher last week.


