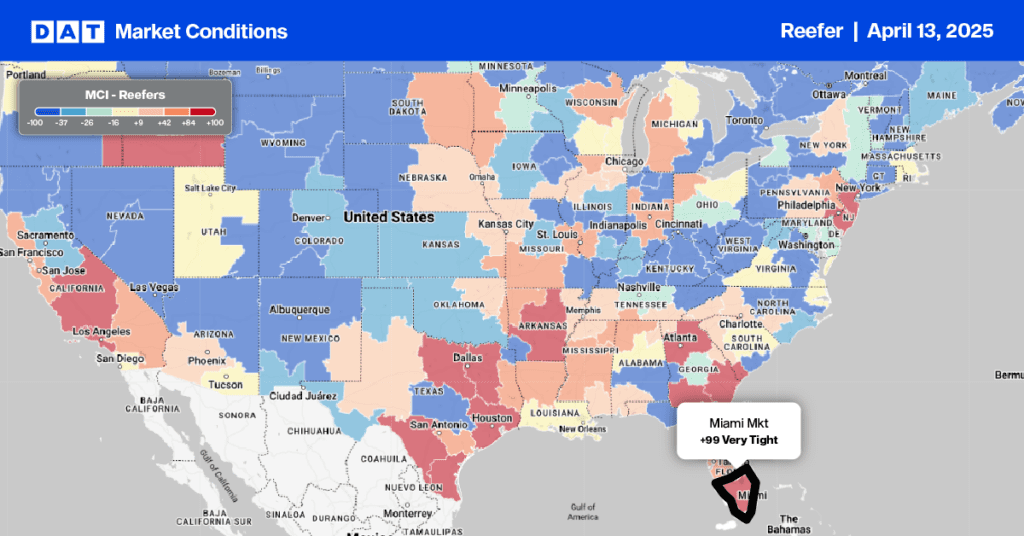
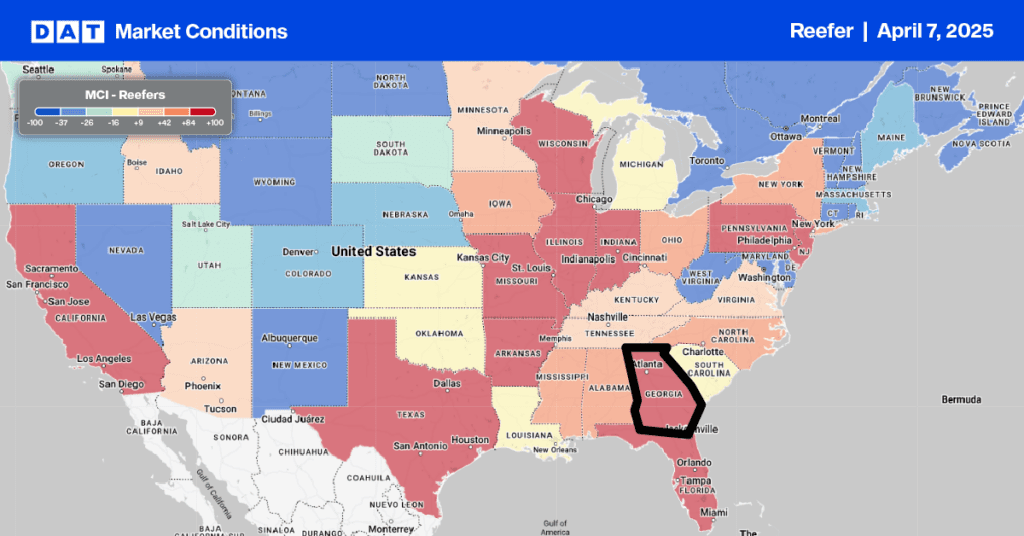
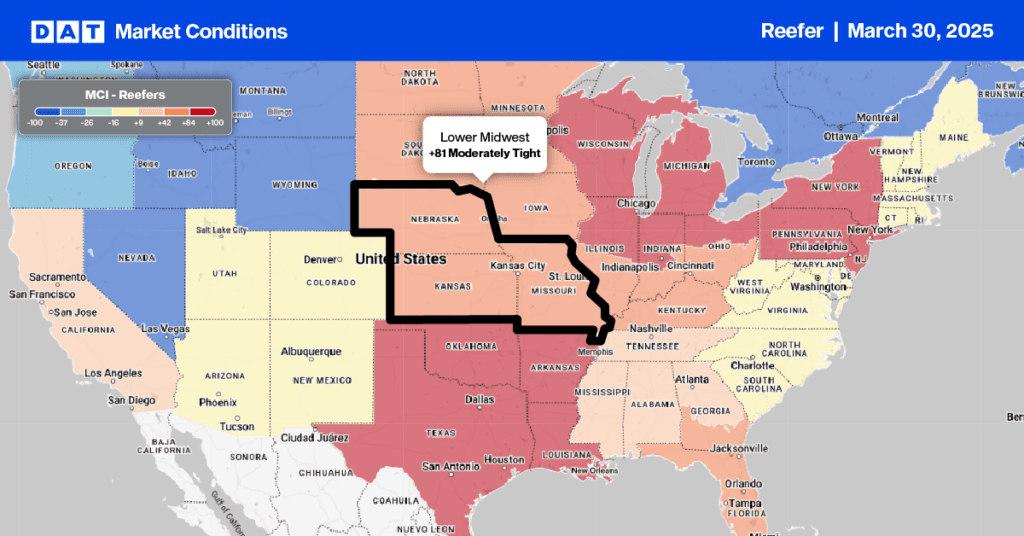
As different regions and crops reach the harvesting stage, we’re starting to see reefer capacity tighten and spot rates rise.
Last week the USDA reported a shortage of trucks in the Columbia Basin in Washington, the Twin Falls-Burley district in Idaho, and the San Luis Valley in Colorado. We’re also seeing shipments of potatoes, vegetables and berries from Central and South Florida, apples from Michigan, and sweet potatoes from Eastern North Carolina.
According to the USDA, the coastal plains region of North Carolina produces around 66% of total annual sweet potato production, followed by Mississippi at 16%. Crop volumes in North Carolina have increased 11% since December and are currently running at just over 300 truckloads per week, just above the 12-month average of 270 loads per week. Loads heading west to Atlanta are up $0.41/mile in the last three weeks to an average of $2.71/mile, excluding fuel this. On the 806-mile haul to Chicago, 3-day averages in RateView report $2.35/mile, excluding fuel, up $0.51/mile since the start of the year.
Find reefer loads and trucks on the largest load board in North America.
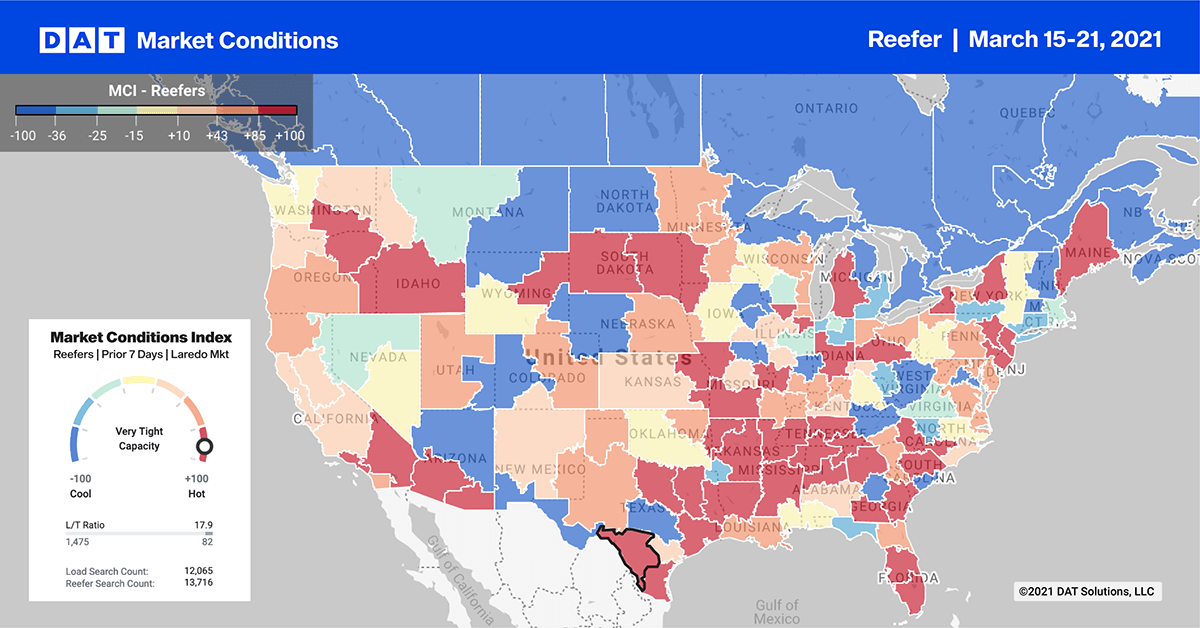
Three markets in the top 10 reported gains this week. Dallas, Twin Falls, ID; and McAllen, TX, reefer volumes increased by 14%, 12% and 13% respectively. There was little change in capacity in each of these markets, with outbound rates staying around $2.37/mile, $2.74/mile and $2.48/mile respectively.
In Miami, capacity tightened on lower volumes, pushing rates up by $0.07/mile to $2.07/mile, excluding fuel. In the neighboring Lakeland, FL, market, volumes dropped 9% and capacity eased, forcing rates down by $0.04/mile to $1.88/mile.
Farther north in Elizabeth, NJ, volumes dropped by 28%, although reefer capacity was tight and drove outbound rates up to $2.50/mile.
Spot rates forecasts
With very little change in reefer volume and capacity, rates stayed around the $2.62/mile, excluding fuel. Compared to the same week in 2020, reefer spot rates are now $0.61/mile higher and remain at record highs.
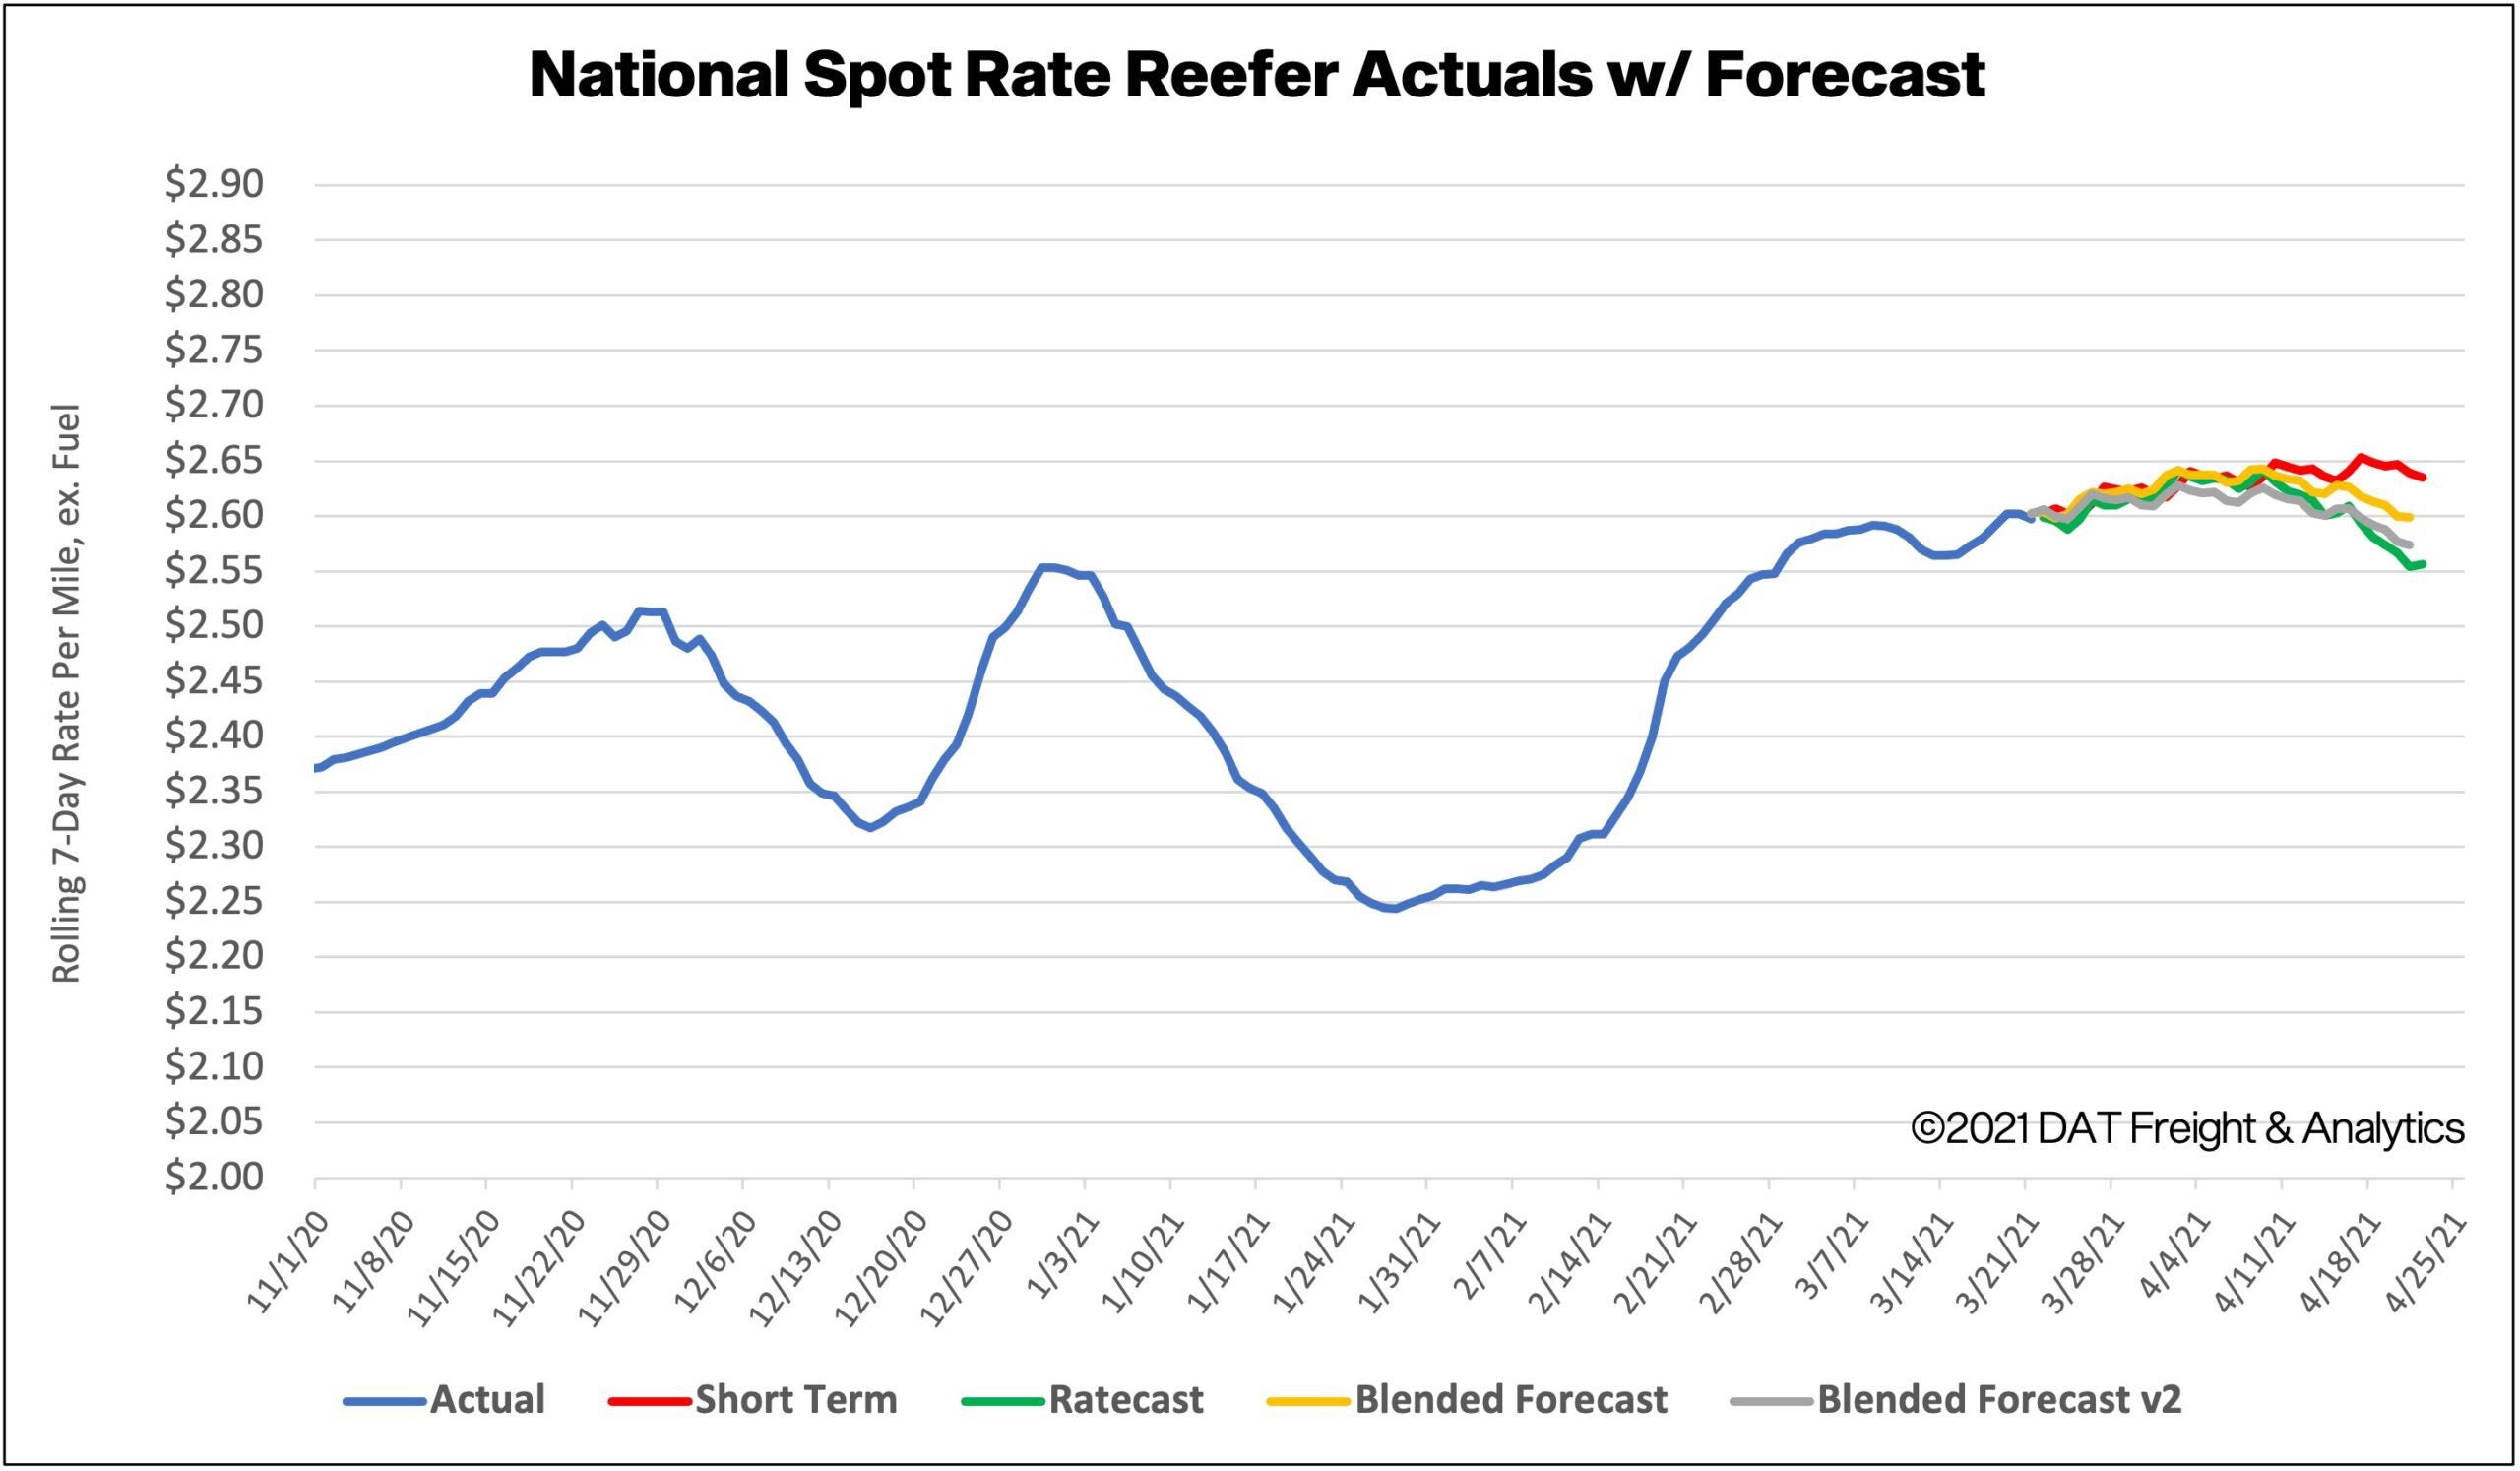
How to interpret the rate forecast:
- Ratecast: DAT’s core forecasting model
- Short Term Scenario: Formerly the pessimistic model that focuses on a more near-term historical dataset.
- Blended Scenario: More heavily weighted towards the longer-term models.
- Blended Scenario v2: More heavily weighted towards the shorter-term models.
