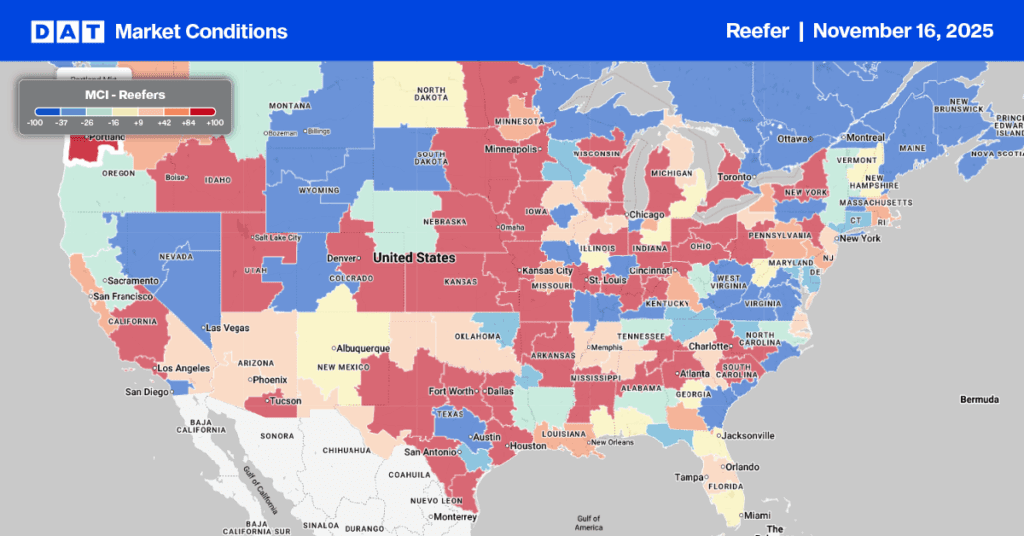
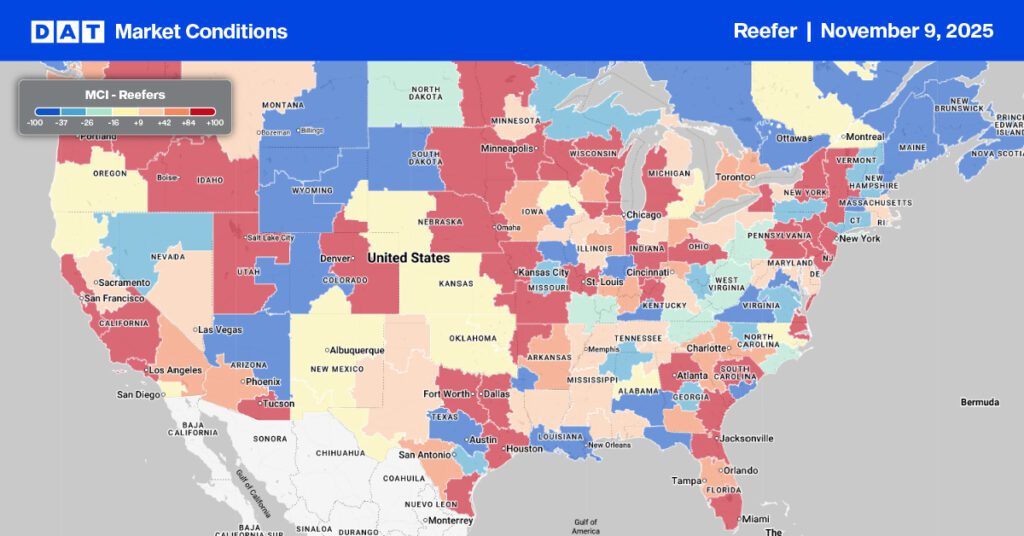
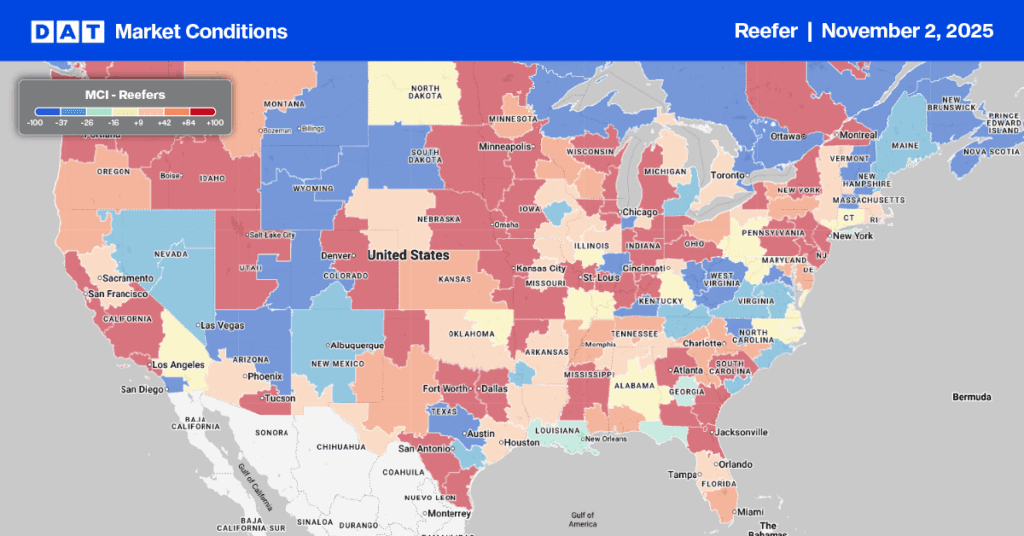
Halloween is just around the corner, and we’re already seeing a sea of orange at local farm stands and grocery stores. Halloween demand for decorative (carving) and processed pumpkins are expected to peak shortly.
Find loads and trucks on the largest load board network in North America.
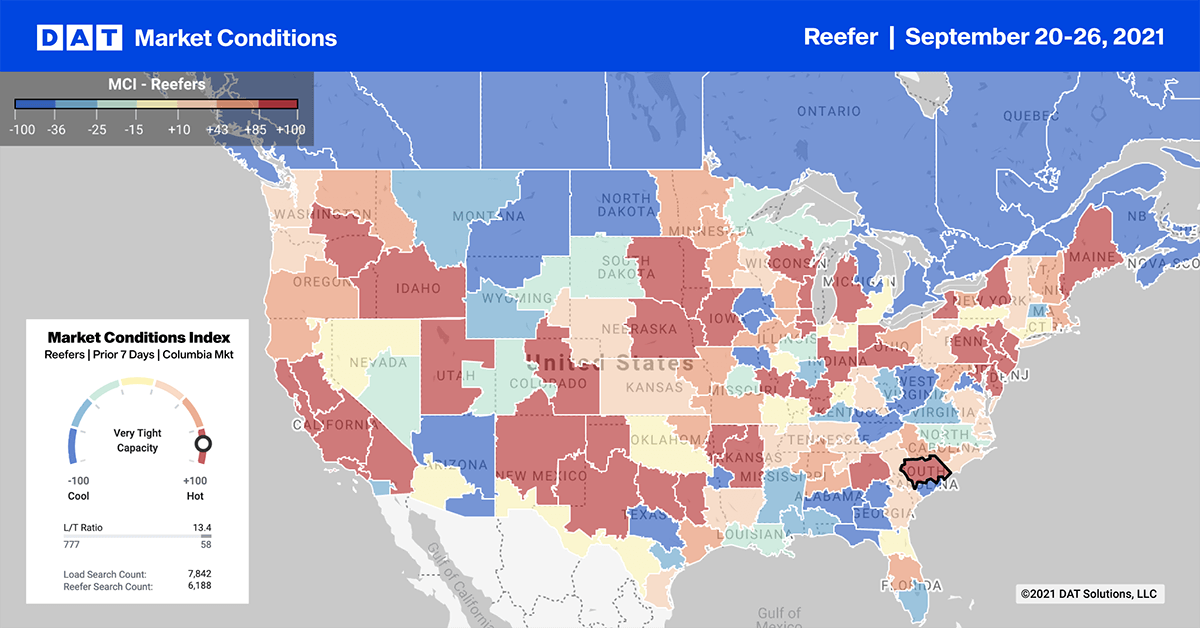
Note: All rates exclude fuel unless otherwise noted.
Although pumpkins are grown in most states, 62% of production comes from just 10 states. The top five pumpkin-producing states are:
- Illinois
- Pennsylvania
- Indiana
- Texas
- California
These five states produce around one billion pounds annually (or about 25,000 truckloads). Just under 40% of that volume comes from Illinois, which is the nation’s largest producer of pumpkins for pies and other processed foods
Illinois will ship approximately 12,500 truckloads between mid-September and the start of November. In the Rock Island, IL market, where there’s the highest concentration of pumpkin farming in the state, outbound reefer volumes were up 9% last week. Rates were up $0.46/mile over the August average to $4.18/mile for loads to Dallas.
Higher avocado import volumes (up 31%) across the southern border last week boosted truckload import volumes, which were up 14%. Almost all the avocado volume (98%) crossed into the U.S. in the McAllen and Laredo markets where reefer capacity was tight, pushing up spot rates by $0.01/mile last week to an average outbound rate of $2.26/mile.
The overall produce trend is still down though. Since the July 4 peak, total produce volumes have decreased by 29% and are tracking normal seasonal trends.
The New England cranberry harvest got underway last week contributing to higher reefer demand, which was up 8% last week. Average outbound spot rates were also up by $0.04/mile to $2.53/mile.
In the Twin Falls, ID market in the Pacific Northwest, capacity tightened again last week following four weeks of rate increases. It’s now at $3.12/mile after increasing by $0.14/mile last week. Loads to Stockton, CA were averaging $2.57/mile, which is up $0.25/mile over the August average.
Spot rates
Following five weeks of gains, the reefer spot market cooled off again last week with the national average spot rate dropping by $0.02/mile to $2.85/mile. This is $0.51/mile higher than this time last year. Rate movement across our Top 70 reefer lanes neutral on 31 lanes (vs. 31 the week prior). Rates were up on 13 (20) lanes and down on 26 (19) lanes.
Of our Top 70 lanes (for loads moved), spot rates:
- Increased on 13 lanes (compared to 20 the week prior)
- Remained neutral on 31 lanes (same as last week)
- Decreased on 26 lanes (compared to 19)
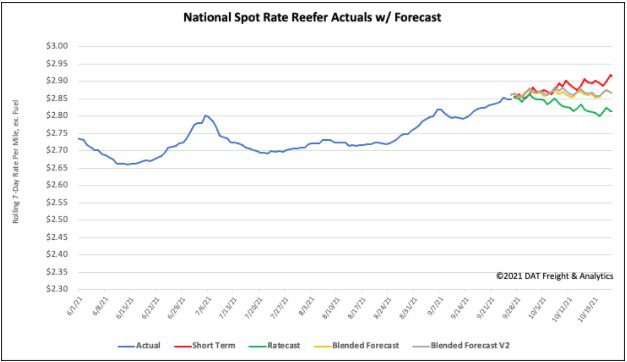
How to interpret the rate forecast:
- Ratecast: DAT’s core forecasting model
- Short Term Scenario: Formerly the pessimistic model that focuses on a more near-term historical dataset
- Blended Scenario: More heavily weighted towards the longer-term models
- Blended Scenario v2: More heavily weighted towards the shorter-term models
