A lot of recent news has been focused on imports flooding into the country but very little about the resulting impact on exports.
At the Port of Los Angeles, the country’s number one port by import volume, two out of every three containers are shipped back empty to Asia. Port officials say strong American consumer demand has resulted in a 30% increase in cargo volume this year. But the tidal wave of containers coming in created such an imbalance in the market. Exports are now down 23% from the same time last year.
Find loads and trucks on the largest load board network in North America.
Note: All rates exclude fuel unless otherwise noted.
“Some shipping lines are working to get empty containers back to factories in Asia as quickly as possible,” says Gene Seroka, executive director of the Port of Los Angeles. This will reduce the available supply of containers for inland exports.
In his weekly port update, Seroka said:
“Trying to find a way to get an empty container chassis and truck power from the Chicago area up to the Red River Valley of North Dakota to load up with soybeans, or no. 5 red wheat has been an elusive solution to all of us. The repositioning costs are extraordinarily high and only exacerbated with this import buying surge that we’ve witnessed in the last year.”
The same trend is occurring on the East Coast in Savannah, which is the number one port by export volume. Export container volumes are down 27% since the start of the year with similar results reported in New York and Long Beach.
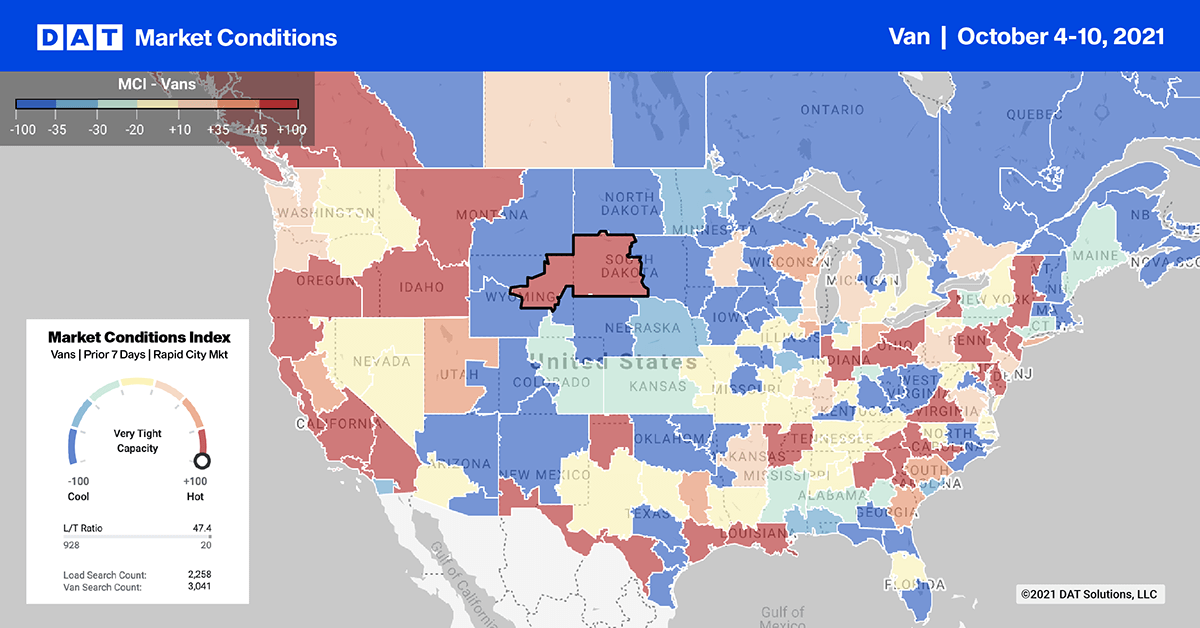
Port congestion in Los Angeles appears to be easing as the number of vessels tied up at anchor sits around 60 today — that’s down from the record-high 73 vessels recorded on September 15. Even though total truckload volumes in Los Angeles dropped last week, capacity was still very tight as spot rates moved up for the fourth week in a row to an average of $3.33/mile — up $0.05/mile last week.
On the high-volume lane between Los Angeles and Chicago, loads moved were up another 5% last week and more than double this time last year. Spot rates on this lane are up 16% since last year and are now averaging $2.93/mile this week.
Loads from Los Angeles to the Phoenix warehouse market are averaging $4.50/mile this week. Los Angeles loads to Denver are averaging $3.35/mile.
On the East Coast in the country’s number four port in Savannah, imported container volumes were relatively flat in September compared to August. Outbound truckload volumes followed a similar trend over the first two weeks of October.
Further north in Elizabeth, N.J., the country’s number two port by import container volume, truckload volumes dropped 10% last week with outbound spot rates dropping $0.02/mile to an average of $2.42/mile. Loads from Elizabeth to Chicago hit a new 12-month high of $2.29/mile, which is $0.74/mile higher than this time last year.
Capacity was also much tighter last week in the Harrisburg market — another large east coast warehouse market — average outbound rates went up $0.09/mile to $2.78/mile.
Spot rates
The rate of increase in dry van spot rates slowed last week after they increased by half a penny per mile to end at $2.54/mile. Compared to the same week last year, dry van rates are still 13% — or $0.33/mile — higher. They’re also just under $1.00/mile higher than the 10-year average for the first shipping week of October.
Of our Top 100 lanes (for loads moved), spot rates:
- Increased on 38 lanes (compared to 40 the week prior)
- Remained neutral on 34 lanes (compared to 36)
- Decreased on 28 lanes (compared to 24)
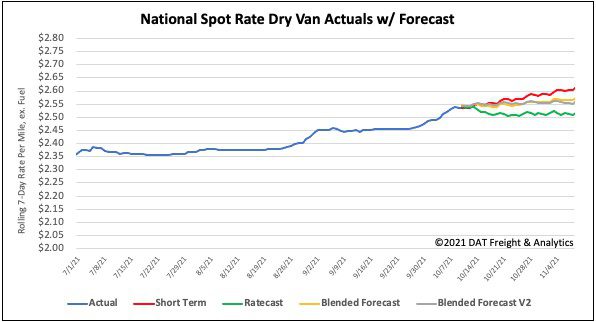
How to interpret the rate forecast:
- Ratecast: DAT’s core forecasting model
- Short Term Scenario: Formerly the pessimistic model that focuses on a more near-term historical dataset
- Blended Scenario: More heavily weighted towards the longer-term models
- Blended Scenario v2: More heavily weighted towards the shorter-term models
