Last year was a record-breaking year in many respects, including the record quarterly revenue of $1.945 billion reported by Jacksonville-based flatbed and specialized carrier Landstar System, Inc. (NASDAQ:LSTR). Compared to the same period in 2020, 4Q21 revenues were up 50% compared to $1.296 billion in the 2020 fourth quarter.
According to a press release from Jim Gattoni, president and CEO, “Following a record-breaking 2021 third quarter, the 2021 fourth quarter once again reset the standard as the best quarterly financial performance in Landstar history. Q4 revenue, gross profit, variable contribution, net income and diluted earnings per share each set all-time quarterly records”.
Revenue hauled by independent business capacity owners (“BCOs”) and truck brokerage carriers in the 2021 fourth quarter was $1.745 billion, or 90% of revenue, compared to $1.202 billion, or 93% of revenue, in the 2020 fourth quarter. The number of Landstar BCOs has also increased by 17% since the pandemic began in March 2020 to a total of 11,057, which is up 8% y/y, and even though the 4Q21 result was up 0.9% q/q, the rate of increase is slowing considerably. The flatbed division represented 22% of total revenue in 4Q21 and reported an increase in revenues of $436.7 million, up 40.3% y/y compared to the last quarter of 2020. Flatbed revenue per load increased by 19.8% ($515) to $3,113/load, while the number of flatbed loads hauled in 4Q21 also increased by 17.1% y/y.
Gattoni said, “As we look to the 2022 first quarter, we anticipate continued solid performance on the expectation that ongoing capacity constraints will support a strong freight environment in the near term. The strength in revenue per truckload in 2021 has continued into the first few weeks of January. Regardless, I expect strong trends in revenue per truckload through the remainder of this quarter. As such, I expect revenue per load on loads hauled by truck to increase 14 to 17% and loads hauled to increase by 12 to 14%, respectively, in the 2022 first quarter over the 2021 first quarter.”
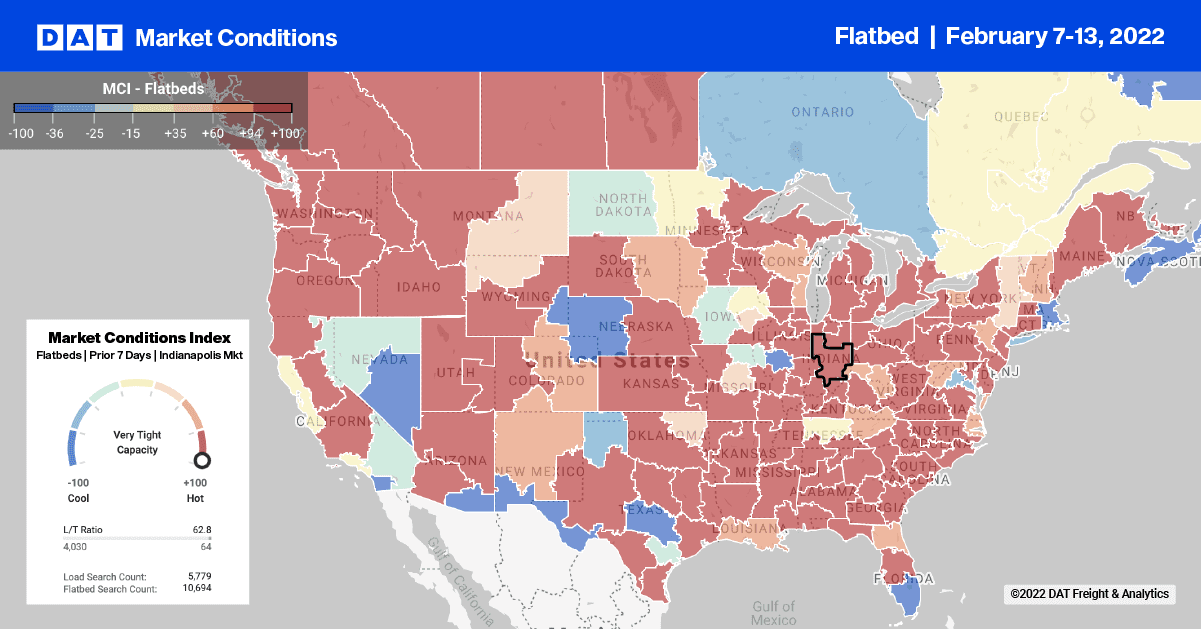
Flatbed loads moved have increased for the fourth week in a row and are now up 24% m/m – quite unusual for winter. On DAT’s number one flatbed lane between Houston and Ft. Worth, loads moved increased another 9% last week and are now up 38% in the previous month. There are still sufficient trucks to meet demand explaining why spot rates have been relatively flat since last June. Spot rates are averaging $3.23/mile this week, which is just over $1.00/mile higher than the same week in the previous year. Another popular flatbed lane is Houston to Lubbock in the Permian Basin oilfield. After being flat for the previous three months, spot rates have dropped by $0.50/mile in the last few weeks to an average of $2.50/mile this week after peaking last July at $3.43/mile excl. FSC.
Capacity is also tight on the “steel lane” from Gary, IN, to Pittsburgh, PA. Spot rates hit a new 12-month high of $4.19/mile excl. FSC last week, which is $0.90/mile higher than the previous week last year. Capacity remained tight in the Pacific Northwest last week, where spot rates increased by $0.17/mile to $2.59/mile excl. FSC for loads from Portland to Los Angeles while loads to Phoenix were $0.30/mile higher at $2.89/mile excl. FSC. On the Gulf Coast in New Orleans, where capacity has been flat since November, the market tightened last week, pushing spot rates up by $0.57/mile above the previous month’s average of $2.62/mile excl. FSC to end the week at an average of $3.19/mile excl. FSC.
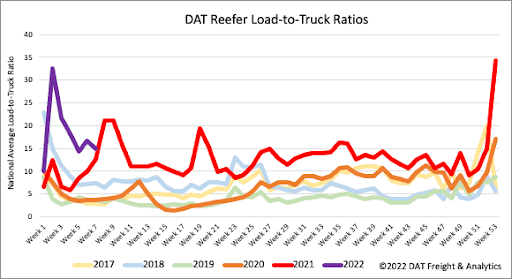
A better week weather-wise resulted in a 7% w/w increase in load post volumes and a 3% w/w increase in loads moved. The number of carriers posting their equipment on DAT’s load board hasn’t changed much in the last four weeks resulting in last week’s flatbed load-to-truck ratio increased slightly from 72.36 to 74.82.
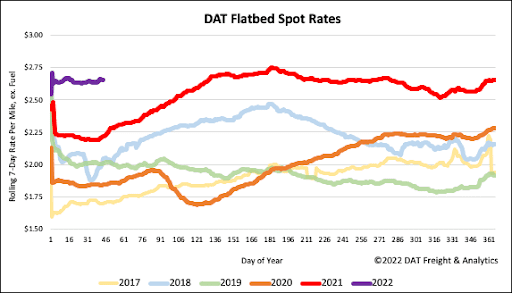
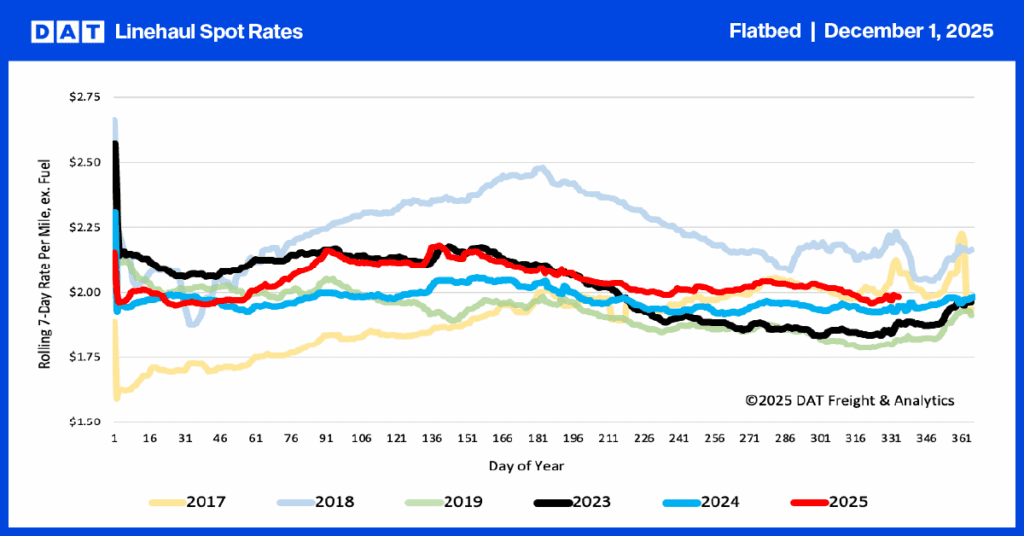
Flatbed spot rates have been just that…. flat since the start of the year. After decreasing by a penny per mile the week prior, last week, they increased by the same amount leaving the national average flatbed rate at $2.66/mile excl. FSC. The national average was still $0.44/mile higher than the same period last year and $0.61/mile higher than the same week in 2018.
