By Christina Ellington
The Institute for Supply Management (ISM®) Purchasing Managers Index (PMI®) continues to be a reliable indicator of future demand for truckload carriers. Being a diffusion index, the PMI means any reading above 50 indicates economic expansion, so the 56.1% May reading confirms the economy has expanded for 24-months in succession. It increased 0.7% from the April reading of 55.4%. The May report showed growth in four of the five subindexes that factor into the PMI®; the new orders index was up 1.6% m/m, the production index was up 0.6%, inventories index was up 4.3%, and new export orders were up 0.2%.
“Manufacturing performed well for the 24th straight month, with demand registering faster month-over-month growth and consumption softening due to labor force constraints. Overseas partners’ disruptions are beginning to impact U.S. manufacturing, creating a near-term headwind for factory output growth. Ten percent of panelists’ general comments expressed difficulty obtaining material from their Asian partners, which will impact reliable deliveries in the summer months,” according to Timothy R. Fiore, Chair of the Institute for Supply Management. “All of the six biggest manufacturing industries — Machinery; Computer & Electronic Products; Food, Beverage & Tobacco Products; Transportation Equipment; Petroleum & Coal Products; and Chemical Products — registered moderate-to-strong growth in May. The only industry reporting a decrease in May compared to April is Furniture & Related Products.”
Relating this report to transportation, supply chain professor Jason Miller writes, “May’s ISM PMI manufacturing data were surprisingly strong, especially given the 5 Federal Reserve Board PMIs were mixed for May. These data continue to paint the picture that we are seeing a normalization of economic activity, which in turn is causing freight capacity to feel less constrained. However, normalization does not equal plunging demand. As such, some of the doom and gloom rhetoric seems out of touch with the economic data.”
All rates cited below exclude fuel surcharges unless otherwise noted.
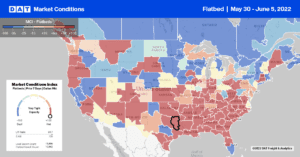
Flatbed capacity tightened again last week in Houston following last week’s $0.25/mile increase to an outbound average of $2.56/mile. The number lane out of Houston for flatbeds is Ft. Worth, 270-miles to the north, where spot rates hit a new 12-month high, averaging $4.02/mile. That’s $0.89/mile higher than the previous year. Loads east to New Orleans are $0.10/mile higher y/y at $3.16/mile, while loads to flood-ravaged Miami hit a new 12-month high at $2.95/mile.
In the Pacific Northwest market of Portland,OR, flatbed capacity was tight last week following the $0.18/mile increase to $1.71/mile. Capacity eased on the popular lane 630-miles south to Stockton, CA, dropping by almost $0.40/mile last week to an average of $2.69/mile. In the largest steel-producing market in Gary, IN, flatbed linehaul rates jumped $0.30/mile to an outbound average of $2.64/mile last week. Loads from Gary to Pittsburgh hit a new 12-month high at $4.18/mile, up by $0.22/mile y/y.
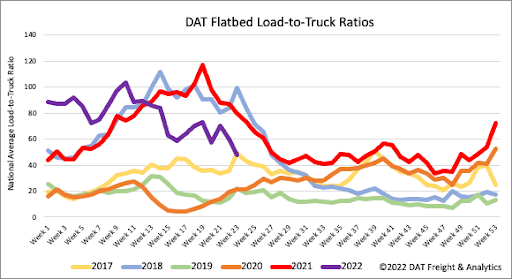
With many construction workers turning the Memorial Day holiday into vacation week, flatbed load post volumes dropped 31% w/w. Combined with 14% fewer carriers posting their equipment on DATs loadboard last week, the flatbed load-to-truck (LTR) ratio dropped to 47.92 from 60.07.
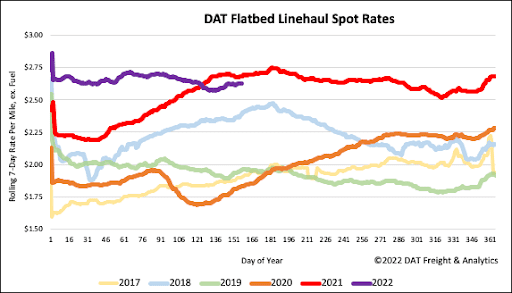
Flatbed linehaul spot rates have remained flat last week, ending the short workweek at just under $2.65/mile. Flatbed spot rates are now $0.06/mile lower than the previous year but still 10% or $0.24/mile higher than in 2018.
