As the early stages of the 2023 produce season begin in southern latitudes, including Florida and Arizona, the 2022 calendar year was a disappointment for reefer carriers. The year ended with total produce volumes at 2016 levels. According to the USDA, weekly truckload volumes of produce ended the year down by 8.5% compared to the end of the previous year. This may improve slightly once California reports citrus volumes, which have yet to be reported for the last quarter of 2022. Noting the citrus reporting lag, total volumes of all commodities in California, the second-largest produce region, were down 21% y/y at the end of December.
Mexico was again the number one produce region where import volumes were up 16% y/y, with the Pacific Northwest, the third highest region, reporting volumes were down by 21% y/y. The Top 5 commodities for 2022 were potatoes (down 3% y/y), apples (down 5% y/y), lettuce (down 1% y/y), watermelons (down 3% y/y), and tomatoes (down 1% y/y). Reefer capacity ended 2022 quite loose compared to the previous year when capacity was very tight and at the highest on the USDA truck availability scale at 5 (representing a shortage of trucks). By the end of 2022, truck availability registered 3 (representing an adequate supply), which is also consistent with most of the over-supplied 2019 freight market. Comparing truck availability at the USDA region level, in December 2021, only two of 20 produce regions reported an adequate supply of trucks, with nine reporting a shortage of trucks. Fast forward to the end of 2022, and 17 of 18 reporting regions reported an adequate supply of trucks, with only the Nogales, AZ, border crossing region reporting a slight shortage.
Market Watch
All rates cited below exclude fuel surcharges unless otherwise noted.
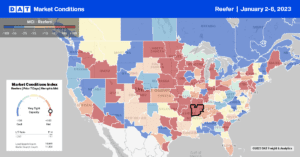
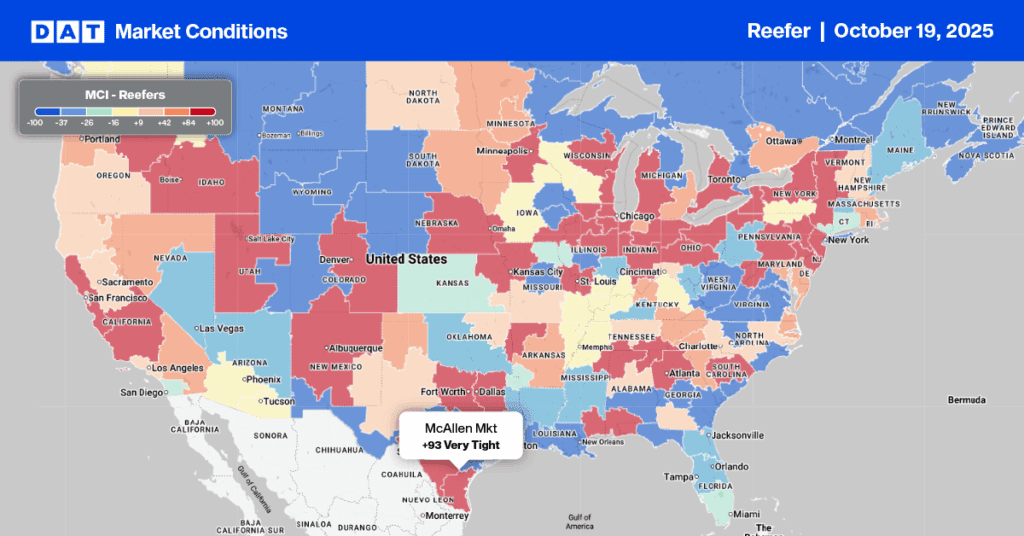
Reefer capacity in the San Joaquin Valley in the Fresno market was relatively flat last week at an average of $2.05/mile for outbound loads but considerably tighter on long-haul lanes to the east. Loads from Fresno to Boston increased by $0.23/mile last week to $1.90/mile, and while linehaul rates on this lane have been steadily climbing over the previous three months, they are still more than $1.00/mile lower than the last year. In Phoenix, refer capacity tightened for the fifth week, with spot rates increasing by $0.18/mile to an average of $2.54/mile. Loads from Yuma, AZ, in the Winter Salad Bowl, to Atlanta were up $0.27/mile over the December average to $2.19/mile last week, and for loads north to Seattle, carriers were accepting loads at an average of $2.86/mile.
In Mid-Atlantic markets, reefer capacity was tighter last week – rates were up by $0.05/mile to $2.04/mile, with most of the gains coming from the Charlotte market, where spot rates increased by $0.14/mile to $2.15/mile. Loads from Charlotte to Bowling Green, KY, continue to climb, and at $2.92/mile, spot rates have been up by $0.44/mile since October. Even though outbound reefer rates decreased by $0.07/mile to $2.36/mile last week in Atlanta, the opposite was the case on DATs highest volume reefer lane south to Lakeland, FL. Last week spot rates were up by $0.46/mile to an average of $3.57/mile, which is around $0.65/mile lower than the previous year.

Load to Truck Ratio (LTR)
Load posts increased 6% w/w and recorded the second-highest volume in the last seven years, just 13% lower than in 2018. In contrast, carrier equipment posts remained at their highest level in seven years, more than double the number of carriers posting their equipment during the prior oversupplied market in 2018 and 2019. As a result of higher volumes and a 16% w/w increase in equipment posts, last week’s reefer load-to-truck (LTR) decreased from 12.87 to 10.18.
Spot Rates
Last week’s national average reefer linehaul rate, at $2.37/mile, is around 25% or $0.80/mile lower than the start of the previous year. Reefer spot rates typically start the year strong before cooling over the first quarter, except for 2018, when available capacity was tight. Last week’s spot rate was just $0.03/mile lower than in 2018.


