Truckload freight volumes declined, and national average spot rates for dry van and refrigerated (“reefer”) loads fell for the fourth consecutive month in April. The DAT Truckload Volume Index (TVI), a measure of loads moved during a given month, was lower for all three equipment types:
- Van TVI was 206, down 15.5% from March and 12.3% lower year over year.
- Reefer TVI fell to 154, a 16.3% decline from March and 12.5% lower year over year.
- Flatbed TVI was 239, 13.7% lower compared to March but 3.5% higher year over year.
It’s not unusual for truckload freight volumes to decline from March to April. However, the van and reefer TVI numbers were the lowest since February 2021, when a polar vortex and unprecedented winter storms disrupted logistics activity across large areas of the United States and Canada.
“May will be pivotal for shippers, brokers, and carriers,” said Ken Adamo, DAT’s Chief of Analytics. “After a challenging first four months of the year, we expect to see the effects of seasonality on freight volumes and rates. The question is how sustainable those effects will be.”
Truckload demand and pricing eased
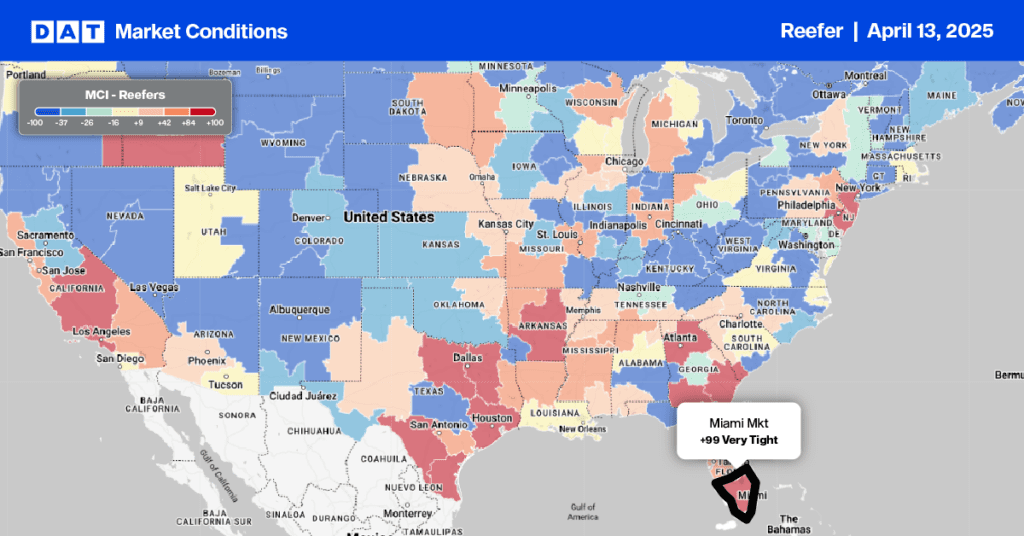
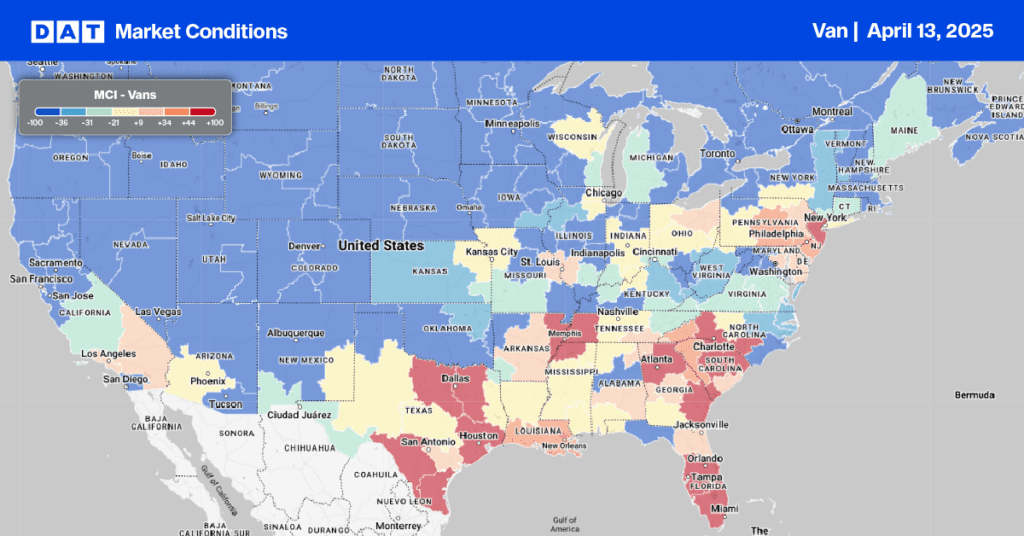
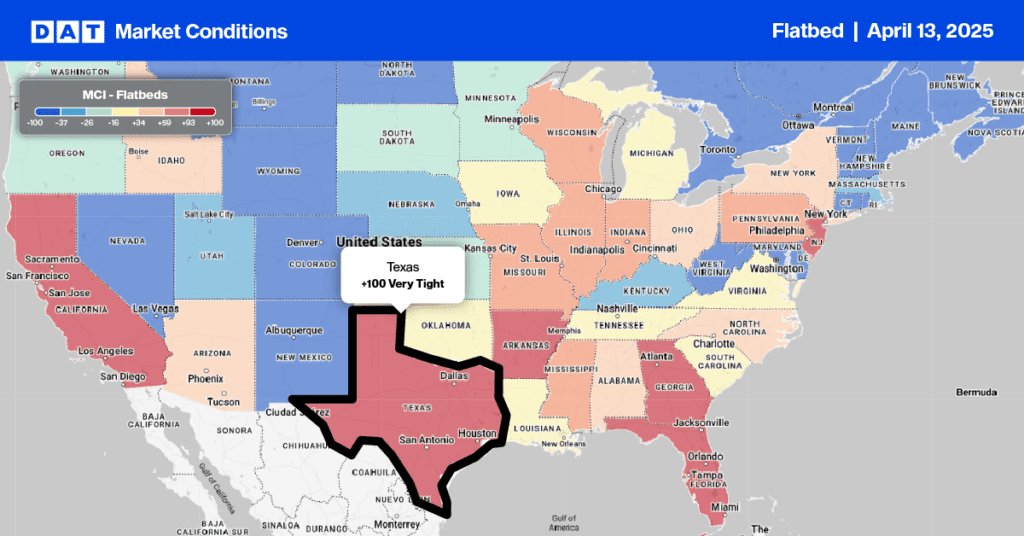
National average load-to-truck ratios decreased, indicating weaker demand for truckload capacity on the spot market. The last time van and reefer ratios were this low was May and April 2020, respectively, during the supply chain shocks of the pandemic:
- The van ratio was 1.9, down from 2.0 in March, and 3.4 in April 2022.
- The reefer ratio was 2.7, down from 3.0 in March and 6.3 year over year.
- The flatbed ratio was 12.1, down from 12.1 in March and 64.5 year over year.
Lower demand for truckload services led to a drop in national average spot van and reefer rates:
- The spot van rate averaged $2.06 per mile, down 10 cents compared to March and 71 cents lower year over year.
- The spot reefer rate fell 9 cents to $2.41 a mile, 72 cents lower than in April 2022.
- The spot flatbed rate dipped 4 cents to $2.67 a mile, down 70 cents year over year.
Line-haul rates, subtracting an amount equal to a fuel surcharge, continued a pattern of month-over-month declines in 2023. The national average van line-haul rate was $1.59 per mile, down 8 cents compared to March, while the reefer line-haul rate fell 7 cents to $1.89 a mile. The average flatbed line-haul rate was $2.10 a mile, down 2 cents.
Fuel surcharge amounts fell 2 cents to an average of 47 cents a mile for van freight, 52 cents for reefers, and 57 cents for flatbeds. At $4.10 a gallon, the price of diesel was 11 cents lower compared to March.
Will seasonality kick in?
National average rates for contracted freight were lower compared to March, but the spread between contract and spot rates rose to near all-time highs: 62 cents for van freight, 60 cents for reefers, and 66 cents for flatbeds.
Adamo called the spread between spot and contract rates “an indicator of where we’re at in the freight cycle—the balance of bargaining power among shippers, brokers, and carriers.”
For the gap to close, two things need to happen. “One, the supply of trucks on the spot market needs to diminish, which unfortunately means more carriers exiting the market. Two, there needs to be a higher demand for trucks—in other words, shippers with more loads than they planned for.
“In 2016 and 2019, it was precisely the third week in May when the spot market entered a recovery phase after prolonged declines and stagnation,” he explained. “Seasonality kicked in, and shippers needed more trucks to move fresh produce, construction materials, imports, and summer and back-to-school retail goods. If we see an uptick in demand before Memorial Day, it will be a welcome sign for owner-operators and small carriers as we head into the summer and fall.”
About the DAT Truckload Volume Index
The DAT Truckload Volume Index reflects the change in the number of loads with a pickup date during that month; the actual index number is normalized each month to accommodate any new data sources without distortion. A baseline of 100 equals the number of loads moved in January 2015, as recorded in DAT RateView, a truckload pricing database and analysis tool with rates paid on an average of 3 million monthly loads.
Spot truckload rates are negotiated for each load and paid to the carrier by a freight broker. National average spot rates are derived from payments to carriers by freight brokers, third-party logistics providers, and other transportation buyers for hauls of 250 miles or more with a pickup date during the month reported. DAT’s rate analysis is based on $150 billion in annualized freight transactions.
Load-to-truck ratios reflect truckload supply and demand on the DAT One marketplace and indicate the pricing environment for truckload freight.


