Although the Institute of Supply Management’s (ISM) Purchasing Managers Index (PMI) increased by 1.4% month-over-month (m/m) in September, economic activity in the manufacturing sector contracted for the eleventh consecutive month. Last month’s PMI reading came in at 49%, with a manufacturing reading above 48.7% over an extended period, generally indicating an expansion of the overall economy. The New Orders Index remained in contraction territory at 49%, 2.4 percentage points higher than the figure of 46.8 percent recorded in August.
According to Timothy R. Fiore, Chair of the Institute for Supply Management Manufacturing Business Survey Committee, “The U.S. manufacturing sector continued its contraction trend but at a slower rate, recording its best performance since November 2022, when the PMI also registered 49%. Companies are still managing outputs appropriately as order softness continues, but the month-over-month PMI improvement in September is a clear positive. Demand eased marginally, with the New Orders Index contracting slower, the New Export Orders Index continuing in contraction territory but with a marginal increase, and the Backlog of Orders Index declining.”
The five manufacturing industries that reported growth in September are Nonmetallic Mineral Products, Food, Beverage and Tobacco Products; Textile Mills, Primary Metals; and Petroleum and Coal Products.
The 11 industries reporting contraction in September — in the following order — are Printing and Related Support Activities; Furniture and Related Products; Plastics and Rubber Products; Paper Products; Fabricated Metal Products; Wood Products; Computer and Electronic Products; Machinery; Electrical Equipment, Appliances & Components; Chemical Products; and Transportation Equipment.
Market Watch
All rates cited below exclude fuel surcharges unless otherwise noted.
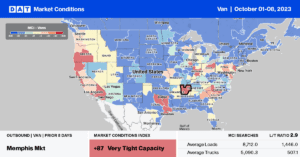
Even though the national average dry van rate dropped just over a penny per mile to $1.58/mile last week, the top five states (CA, GA, IL, NJ, TX) for spot market load post volume increased by the same amount, recording $1.75/mile. At that level, spot rates are just $0.03/mile higher than in 2019. Looking at some of the larger individual freight markets, Los Angeles spot rates increased by $0.03/mile to $1.79/mile, with the same increase recorded next door in Ontario, where outbound spot rates averaged $1.87/mile.
In Dallas and Atlanta, spot rates increased by $0.01/mile to $1.36/mile and $1.49/mile, respectively, and further north in Elizabeth, spot rates were up by $0.02/mile to $1.44/mile. In the combined Joliet and Chicago markets, rates were up by $0.01/mile, averaging $2.02/mile for outbound loads. In the Pacific Northwest (PNW) region, rates increased to an average of $1.32/mile for the fourth week.
Load-to-Truck Ratio (LTR)
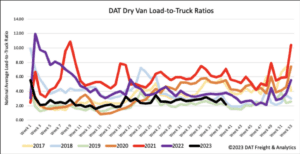
Dry van spot market load posts (LP) dropped by 21% w/w, which isn’t entirely unusual for the first shipping week of the month. The amount of the decrease is worth noting, though, as the last time load posts fell by this much in Week 40 was in 2018. The ongoing auto workers’ strike could be having an impact on spot market volumes. However, it’s still too early to determine if this is the case or just an artifact of a very soft freight market and non-existent peak shipping season (so far). Carrier equipment posts increased by 8% w/w, resulting in last week’s dry van load-to-truck ratio (LTR) dropping by 27% to 2.17.
Linehaul Spot Rates
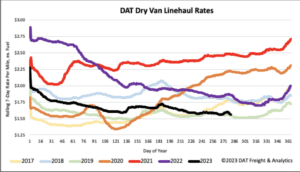
Dry van linehaul spot rates are still around the two-month average following last week’s $0.02/mile decrease. At $1.58/mile, last week’s national average was $0.29/mile lower than last year and only $0.02/mile higher than 2019. Compared to DAT’s Top 50 lanes based on the volume of loads moved, which averaged $1.89/mile last week, the national average is around $0.318/mile lower.
