The 2023 INRIX Global Traffic Scorecard provides valuable insights into the changing traffic patterns in major U.S. freight markets. It identifies the most congested freight corridors in the nation. The busiest stretch of highway was I-4 Westbound near Orlando between the Beachline Expressway and the Western Beltway. Commuting on this route daily at 5:00 PM would result in a driver losing 124 hours to traffic in 2023.
Get the clearest, most accurate view of the truckload marketplace with data from DAT iQ.
Tune into DAT iQ Live, live on YouTube or LinkedIn, 10am ET every Tuesday.
Similarly, drivers traveling on I-5 Southbound in Los Angeles also experience significant traffic congestion. Those who took I-5 between I-10 and I-605 lost 122 hours to traffic when commuting every weekday at 5:00 PM. Several stretches of I-95 were among the top 25 “Busiest Corridors in the U.S.” due to this significant freight and passenger Interstate running along the East Coast of the U.S. Locations such as I-95 in Stamford, CT, Miami, and Washington D.C. were featured as top corridor locations.
Interestingly, only three of the top 25 busiest freight corridors experienced peak traffic in the morning, while the remaining 22 had traffic peaks in the late afternoon and evening, typically around 4:00 – 5:00 PM.
Market watch
All rates cited below exclude fuel surcharges, and load volume refers to loads moved unless otherwise noted.
A capacity shortage was reported in Minnesota last week; load post volumes surged by 61% w/w, and loads moved increased by 35% w/w, driving up state-average rates by $0.18/mile to $2.32/mile. Outbound linehaul rates in St Cloud averaged $2.44/mile, $0.22/mile higher w/w on almost double the volume. Regional lanes, including Madison, WI, and Rockford, Ill, dominated the volume gains, while in the large Minneapolis market, volumes increased by 10% w/w, pushing up spot rates by $0.03/mile to $2.00/mile.
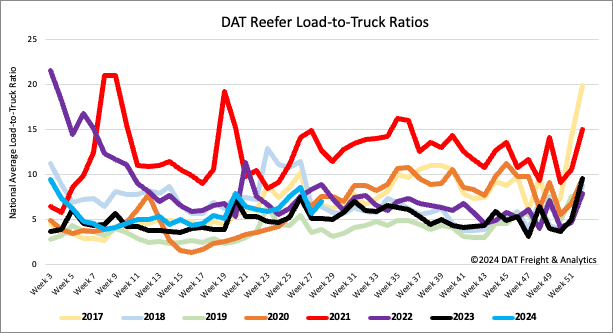
Load-to-Truck Ratio
Reefer load post volume surged last week following the short workweek post-July 4, up 7% y/y and 11% higher than the Week 28 average, excluding years impacted by the pandemic. Carrier equipment posts were 16% higher last week as capacity re-entered the market, increasing the reefer load-to-truck ratio (LTR) by 24% w/w to 7.05, 37% higher than last year.
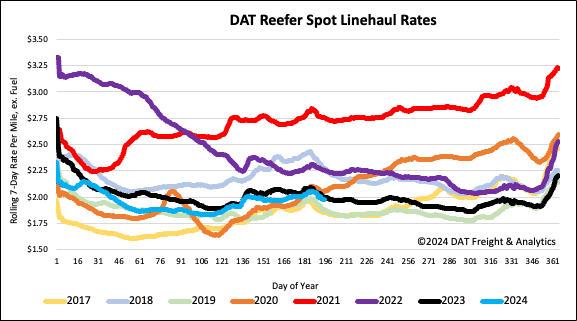
Spot rates
Following the annual July 4 peak, the national average reefer linehaul rate dropped to $2.00/mile following last week’s $0.05/mile decrease, almost identical to the Week 28 week-over-week change going back to 2016. The 2024 produce season peaked at 14% lower than last year but very close to the July 4 peak back in 2019. Produce volumes plunged 24% last week, something we’re watching closely, considering the typical volume drop after Independence Day is closer to 14% w/w.