The 2023 INRIX Global Traffic Scorecard reveals that Friday has the highest number of trips to downtown areas in the U.S., and urban cores also attract trips on Thursday and Friday evenings. While traffic analysts usually focus on morning and evening rush hours, attention should also be given to the increasing traffic during midday. INRIX data shows that nearly the same number of trips start during the midday as during the evening commute.
Get the clearest, most accurate view of the truckload marketplace with data from DAT iQ.
Tune into DAT iQ Live, live on YouTube or LinkedIn, 10am ET every Tuesday.
The U.S. has four of the Top 10 most delayed cities, with New York City topping the global list, followed by Mexico City, London, and Paris. New York City experiences an average of 101 lost hours at an average speed of 11 mph during peak hours, making its congestion a global concern.
Out of the top 25 urban areas in the study, 40% have met or exceeded pre-COVID levels of delay, while only 30% of all U.S. urban areas have reached this threshold. Austin had the most significant rank jump, moving six spots from 27th in 2022 to 21st in 2023 with a 27% increase in delay to 38 hours lost. On the other hand, New Orleans saw the most significant drop in ranking, moving from 19th in 2022 to 24th in 2023.
Market watch
All rates cited below exclude fuel surcharges, and load volume refers to loads moved unless otherwise noted.
An excess capacity in the Great Lakes Region resulted in regional linehaul rates dropping by $0.05/mile to $2.42/mile last week, despite a 27% w/w increase in volume. In the larger Pennsylvania regional lane, spot rates dropped by $0.16/mile to $2.42/mile on a 25% higher volume, although in Pittsburgh, capacity tightened for outbound loads on a 13% higher volume. Most of the gains were reported on the Pittsburgh to the northern Ontario Sudbury market, where spot rates increased by $0.12/mile to $2.90/mile.

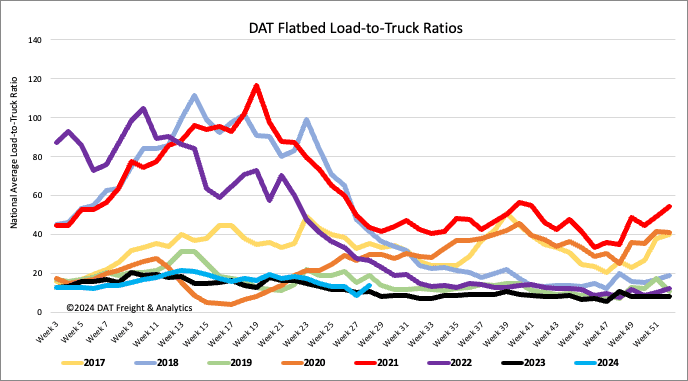
Load-to-Truck Ratio
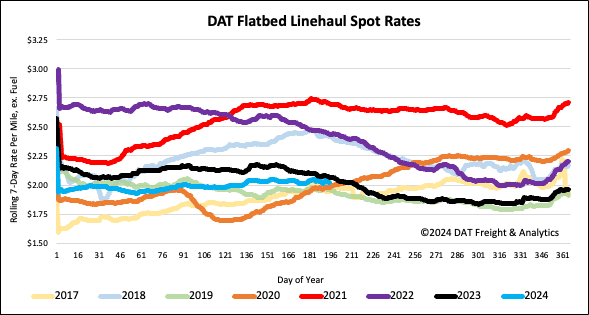
Flatbed load post volumes bounced back last week to be within 2% of last year, but still 38% lower than the Week 28 eight-year average exlcuding years impacted by the pandemic. Carrier equipment posts were up 23% w/w but remain 24% lower than last year, resulting in last week’s flatbed load-to-truck ratio jumping by 59% to 14.18.
Spot rates
The surge in load posts and 9% w/w increase in loads moved kept the national average flatbed spot rate flat around $2.05/mile last week. Flatbed linehaul rates are $0.05/mile lower than last year but higher by the same amount as 2019.