Professor Jason Miller, a respected supply chain expert at Michigan State University, emphasizes the need for more positive developments in the trucking industry as demand remains subdued. The most recent release of the for-hire trucking ton-mile and revenue indexes (TTMI), which are based on output across 41 freight-generating industries, indicates that May’s seasonally adjusted ton-mile index shows freight demand continues along the bottom of a trough, albeit still at absolute levels comparable to what we observed in late 2018.
Get the clearest, most accurate view of the truckload marketplace with data from DAT iQ.
Tune into DAT iQ Live, live on YouTube or LinkedIn, 10am ET every Tuesday.
Seasonally adjusted trucking ton-miles increased 0.4% in May from April. On a not-seasonally adjusted basis, this increase was 0.8% (which indicated the seasonal adjustment model expected a 0.4% increase due purely to seasonality). Regarding absolute demand levels, trucking demand is near where it was in Q4 2018, which saw a slight decline from the peak levels observed in April – August of that year. This trend, while surprising, is a result of the industry still recovering from the significant impact of the COVID-19 pandemic, with volumes down ~4% from the all-time seasonally-adjusted record in March 2022.
Miller said, “As I’ve frequently noted, I don’t see much of a volume recovery coming this year. Sectors like nonmetallic mineral products manufacturing—which accounts for ~5% of for-hire trucking demand and is the 3rd largest manufacturing sector contributor to trucking demand—have given up all of their post-COVID gains and are trending down. This is consistent with slowing construction activity and declining oil drilling.
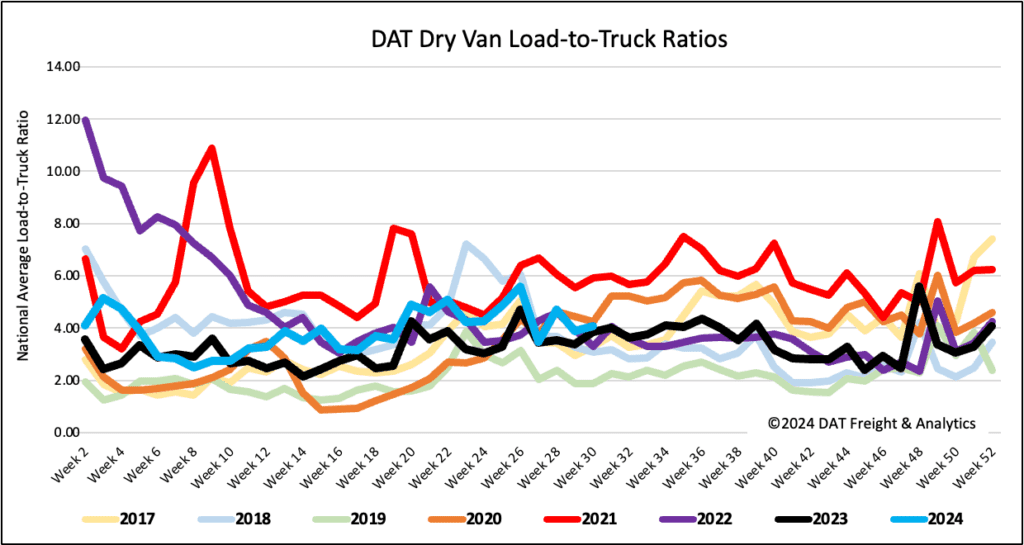
Load-to-Truck Ratio
The number of dry van load postings decreased by 2% last week and is 11% lower compared to the same time last year. Last week’s volumes were 12% higher than the levels in Week 30 over the last seven years, excluding the years affected by the pandemic in 2020 and 2021. The equipment posts by carriers were down 6% week over week, leading to an increase of 5% in the dry van load-to-truck ratio (LTR) to 4.06. This is the highest LTR in eight years, except for 2020, when it was 4.23.
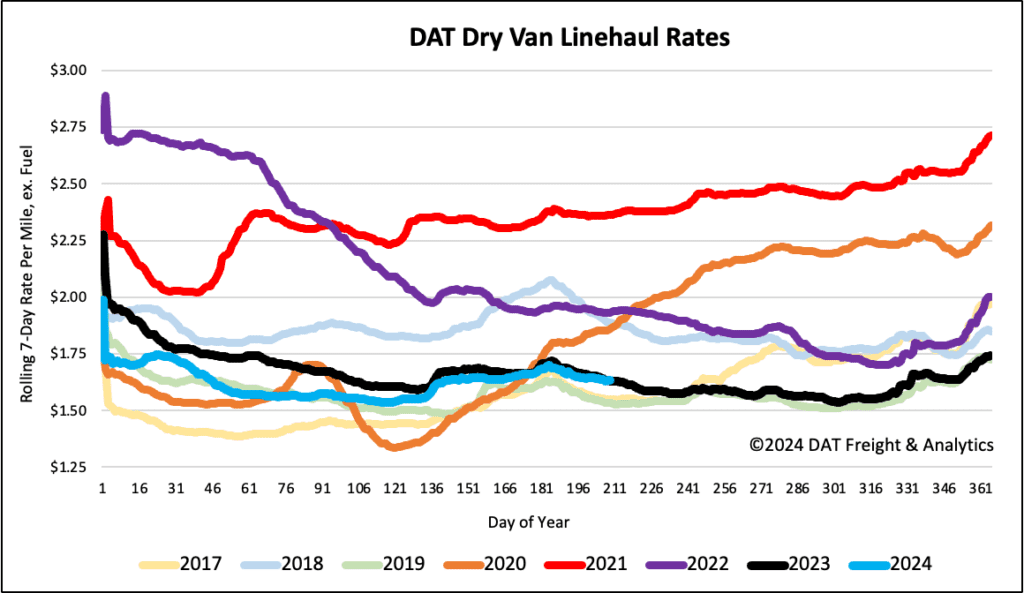
Linehaul spot rates
After dropping by a penny per mile last week, dry van linehaul rates have decreased by $0.06 per mile in the last month. The national average dry van linehaul rate now stands at $1.64 per mile, almost the same as last year. According to DAT’s Top 50 lanes, which are based on the volume of loads moved the rates have dropped by $0.03 per mile to $2.03 per mile. This is $0.39 per mile, higher than the national average.