The Logistics Manager’s Index (LMI) recorded 56.5 in July, up (1.2) from June’s reading of 55.3, marking eight consecutive months of expansion. This is a far cry from last July when the overall index read in at 45.4, its lowest score in the LMI’s eight-year history. The report notes that this more subdued level of growth is attributable to the third consecutive month of contraction in Inventory Levels at 49.5. There is some nuance here, however. For example, in June, inventory levels actually increased upstream (54.7) but contracted downstream (40.0). This suggests that retailers kept inventories lean at the start of Q3 while manufacturers, wholesalers, and distributors built up goods in anticipation of increased demand later in the year.
Get the clearest, most accurate view of the truckload marketplace with data from DAT iQ.
Tune into DAT iQ Live, live on YouTube or LinkedIn, 10am ET every Tuesday.
The LMI score combines eight unique components of the logistics industry, including inventory levels and costs, warehousing capacity, utilization, and prices, and transportation capacity, utilization, and prices. The LMI is calculated using a diffusion index, in which any reading above 50.0 indicates that logistics is expanding; a reading below 50.0 indicates a shrinking logistics industry. The latest LMI results summarize the responses of supply chain professionals collected in July 2024.
Market watch
All rates cited below exclude fuel surcharges, and load volume refers to loads moved unless otherwise noted.
This week, we’re focusing on the Los Angeles market, the nation’s second-largest dry van spot market (after Texas) and the largest port for U.S. containerized imports. The truckload volume is approximately 6% higher than last year and has increased by 8% month-over-month – outbound average linehaul rates are almost 10% higher than last year. This growth is partly due to increased imports as shippers are increasingly concerned about the labor contract covering 45,000 dockworkers on the East and Gulf coasts expiring at the end of the month. In the Los Angeles and Long Beach ports, which accounted for over a third of national containerized import volume, July imports were up by 8% m/m and 18% y/y.
According to the Journal of Commerce (JOC), imports to the East and Gulf coasts must depart Asian load ports by mid-August to ensure they reach store shelves in time for the Black Friday sales after Thanksgiving. Since the voyage time from Asia to the East and Gulf coasts is around 30 days, retailers and importers rush to book their shipments by mid-August to avoid potential issues with a strike by the International Longshoremen’s Association (ILA). The Port of Los Angeles Signal Report predicts the arrival of 24 vessels in the week of August 15, delivering just over 130,000 containers, a 24% increase over last year.
For brokers and carriers, a surge in import container volume leads to a freight overflow into the truckload spot market as shippers rush to transload international containers into 53-foot dry vans for national distribution. All indications suggest that the markets in Los Angeles and neighboring Ontario are heating up in August, especially on the high-volume lanes to Stockton and Phoenix.
Load-to-Truck Ratio
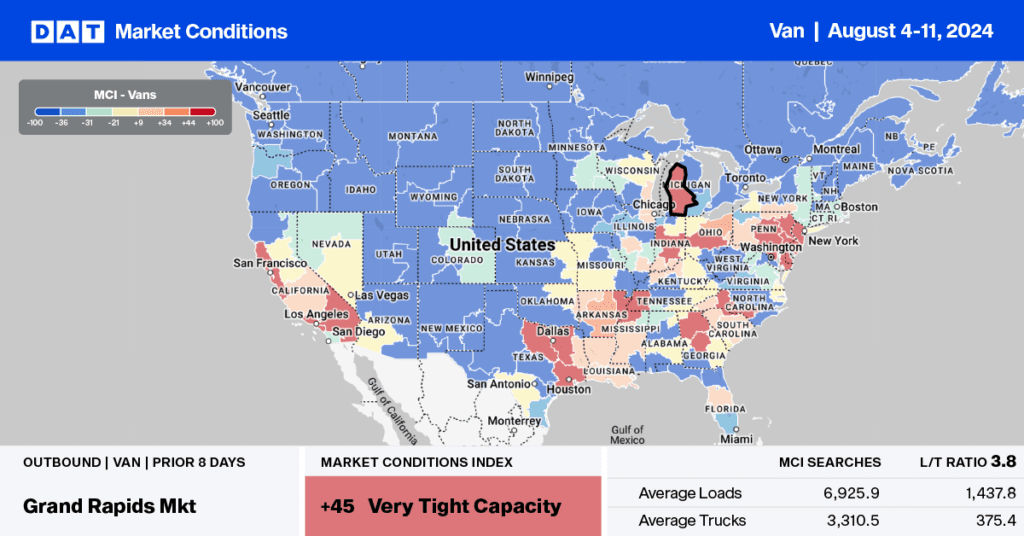
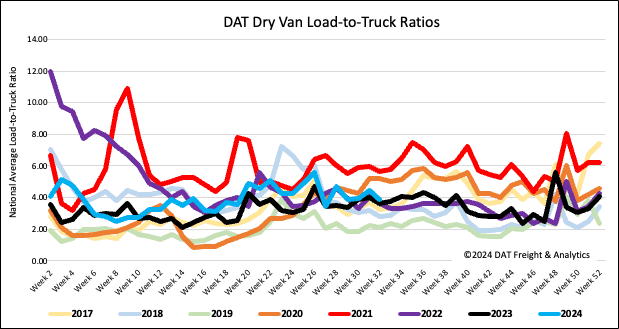
Following the end month-end boost in shipping volume from the prior week, load posts slipped last week, decreasing by 13% and 10% year-over-year. In contrast, last week’s volumes were 2% higher than the levels in Week 32 over the last seven years, excluding the years affected by the pandemic in 2020 and 2021. Capacity loosened slightly on lower volume, leading to a decrease of 13% in the dry van load-to-truck ratio (LTR) to 3.86, which is slightly above the long-term average for this time of the year.
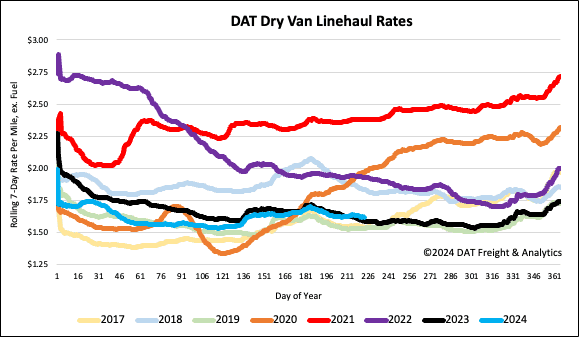
Linehaul spot rates
After remaining flat through month-end, dry van linehaul rates decreased by a penny per mile last week to $1.63/mile, around $0.02/mile per mile higher than last year. According to DAT’s Top 50 lanes, spot rates have dropped by $0.02 to $2.00 per mile based on the volume of loads moved. This is $0.37 per mile, higher than the national average.