If you spend enough time on U.S. interstates, you can’t help but notice the increased volume of oversized loads, especially those wrapped in white plastic, followed by an escort vehicle. Most components include cooling systems to develop artificial intelligence data centers in specialized buildings. For specialized carriers already reeling from the slowdown in construction and agriculture machinery demand, this emerging industry and existing wind and solar energy installation demand is expected to drive more truckload demand for years.
Get the clearest, most accurate view of the truckload marketplace with data from DAT iQ.
Tune into DAT iQ Live, live on YouTube or LinkedIn, 10am ET every Tuesday.
An oversupply of inexpensive real estate with easy access to sufficient power and data connectivity has builders scouring the globe and getting creative. According to real-estate firm CBRE, data center space in the U.S. grew 26% last year, and a record amount was under construction. Bill Vass, vice president of engineering at Amazon Web Services, said a new data center pops up worldwide every three days. Each new installation takes a year and a half or two to build, leading to more demand for truckload carriers well into 2025.
Market watch
All rates cited below exclude fuel surcharges, and load volume refers to loads moved unless otherwise noted.
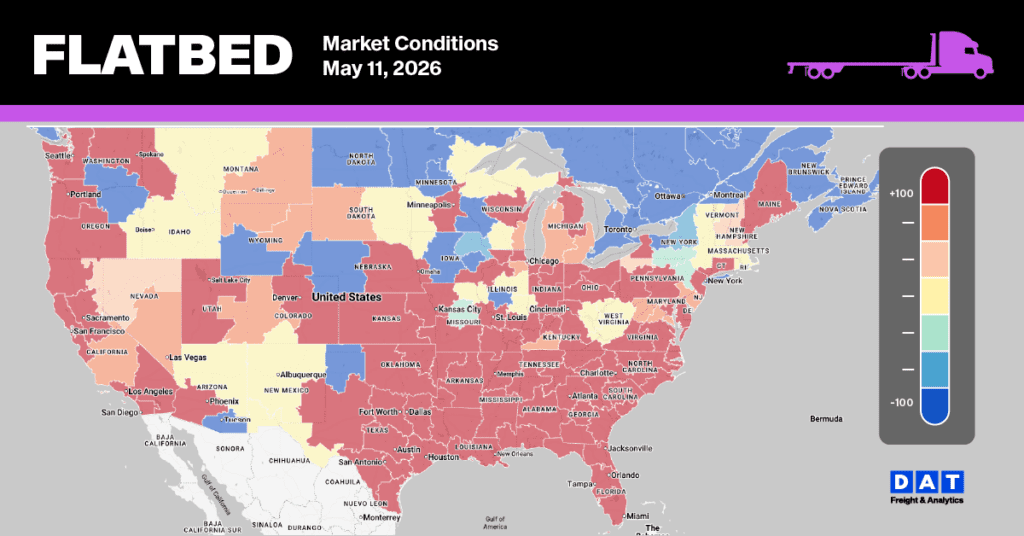
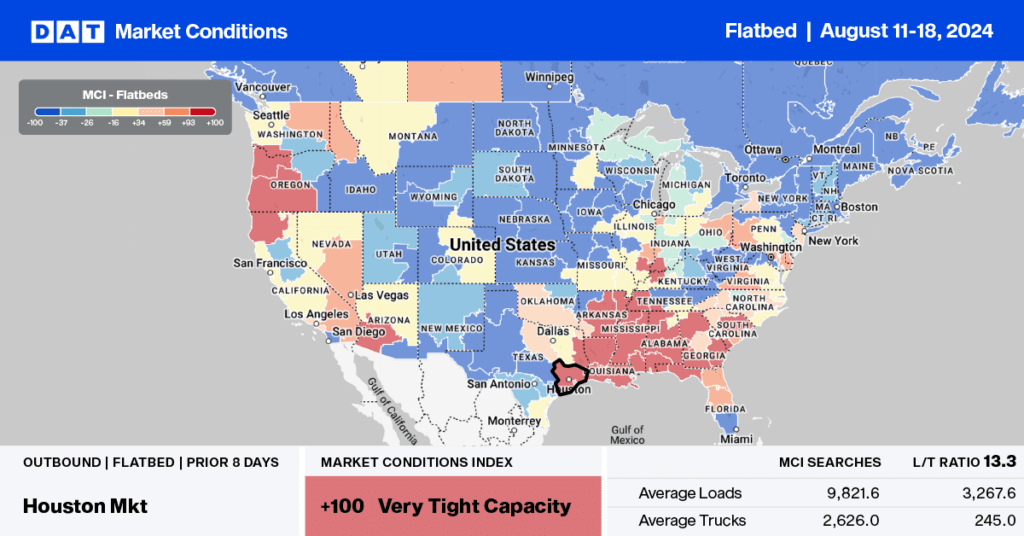
Despite recent layoffs announced by John Deere In Devenport, IA, and near-shoring some production to Mexico, flatbed demand in the Rock Island freight market was very tight last week. Harvest season starts early to mid-September in the Midwest. After a flurry of activity for machinery loads in recent weeks, volumes have decreased, dropping 45% in the last week. Outbound linehaul rates averaged $2.23/mile, down $0.14/mile compared to last year.
Regional loads to Omaha paid carriers an average of $2.73/mile, up $0.16/mile last week, while loads to Columbus, OH, paid an average of $2.15/mile, up $0.11/mile w/w on just over triple the volume last week.
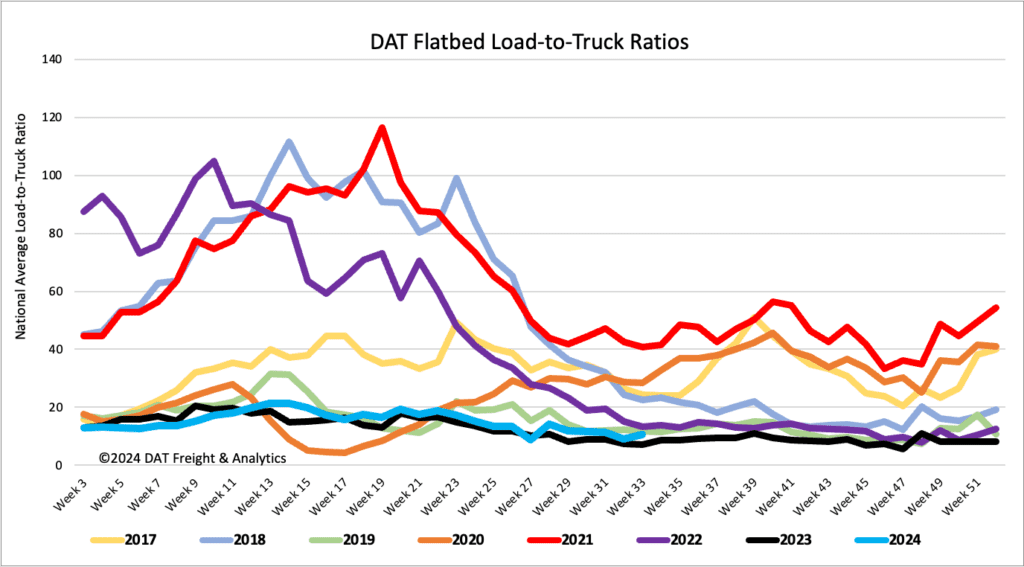
Load-to-Truck Ratio
After decreasing for four weeks, flatbed load post volumes reversed course, increasing by 8% last week, 18% higher than last year, but still 36% lower than the Week 33 eight-year average, excluding years impacted by the pandemic. Carrier equipment posts were down 7% w/w, resulting in last week’s flatbed load-to-truck ratio increasing by 16% to 10.68.
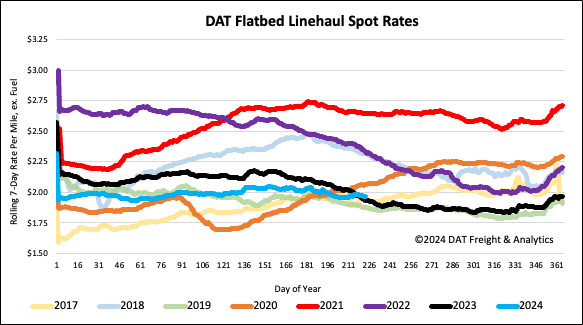
Spot rates
The national volume of loads moved increased by 5% last week and 7.5% higher than last year. The market found sufficient capacity to move the higher volume, resulting in another $0.02/mile decrease in spot rates to a national average of $1.97/mile. Flatbed spot rates are $0.04/mile higher than last year and $0.9/mile higher than 2019.