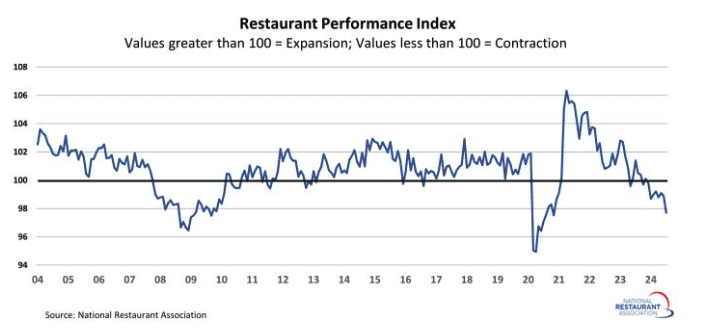
The National Restaurant Association’s Restaurant Performance Index (RPI) fell sharply in July due to broad-based declines in the current situation and expectations indicators. The RPI – a monthly composite index that tracks the health of the U.S. restaurant industry – stood at 97.7 in July, down 1.3% from 98.9 in June.
Get the clearest, most accurate view of the truckload marketplace with data from DAT iQ.
Tune into DAT iQ Live, live on YouTube or LinkedIn, 10am ET every Tuesday.
Restaurant operators reported significantly softer same-store sales and customer traffic readings in July, which led to a sharp decline in the Current Situation Index. Looking ahead, restaurant operators’ 6-month outlook for both sales growth and the economy deteriorated in recent months. Restaurant operators are increasingly pessimistic about sales and the economy in the months ahead.
The RPI is a monthly composite index that tracks the health of the U.S. restaurant industry and is measured in relation to a neutral level of 100. Index values above 100 indicate that key industry indicators are expanding, while index values below 100 represent a period of contraction for key industry indicators.
Market watch
All rates cited below exclude fuel surcharges, and load volume refers to loads moved unless otherwise noted.
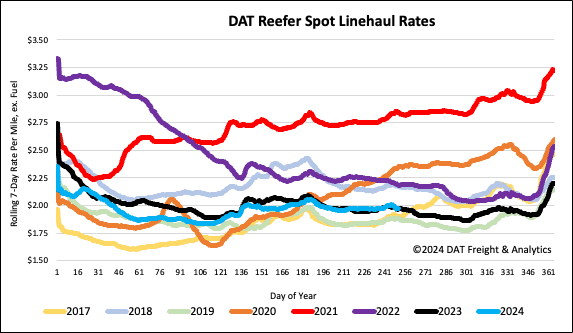
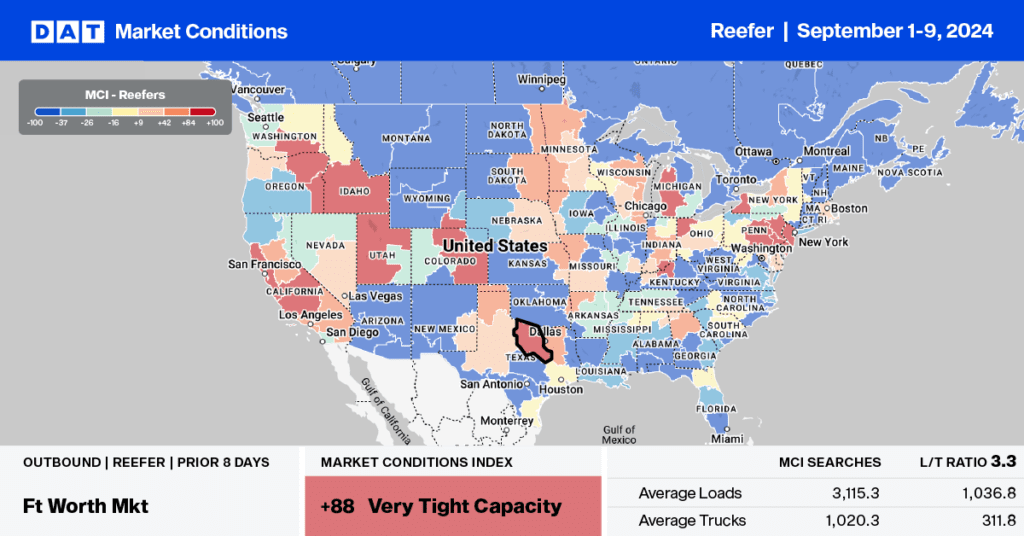
This week, let’s focus on the Pendleton, OR freight market in the Pacific Northwest (PNW) as the Fall Produce season starts to shift higher volumes. Best known for shipping pears, apples, onions, and potatoes, truckload volumes have started to ship significantly from now through Thanksgiving, resulting in a sharp increase in reefer linehaul rates in the last month, up 15% compared to August.
According to the DATs Market Condition Index (MCI), reefer capacity for outbound loads will remain tight over the next two months, especially around the start of November, when Christmas tree Season starts. At $2.02/mile, outbound reefer linehaul rates are just starting to heat-up and are expected to increase by another $0.60/mile or 32% by November based on past seasonality.
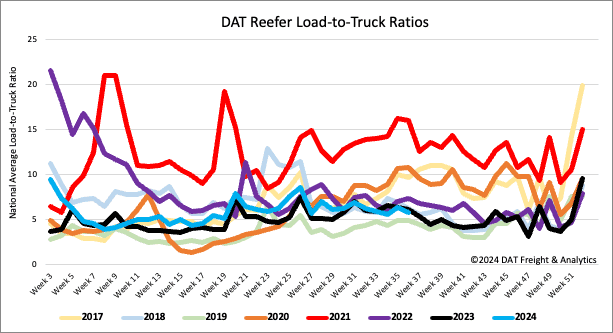
Load-to-Truck Ratio
Reefer load post volumes were lower last week after Labor Day, around 31% lower than the long-term average for Week 36. In August, national produce truckload volumes, including California citrus volumes, were 24% lower than last year, which resulted in fewer spot loads for reefer carriers. As a result, the reefer load-to-truck ratio (LTR) decreased by 10% to 5.74, which is 12% lower than the long-term average for Week 36.
Spot rates
As summer comes to an end after the Labor Day increase in produce truckload volume, reefer truck linehaul rates began to decrease last week, dropping by $0.02 per mile to $1.99 per mile. The national average for last week is the same as last year and approximately $0.04 per mile higher than the long-term average for Week 36, not including the years affected by the pandemic. At $1.99 per mile, reefer spot rates are the same as the average over the past three months.