Truckload volumes of pear shipments typically peak in the first few weeks of November, although this year, growers expect cold weather last winter will translate to lower Northwest pear output for 2024. In August, the USDA predicted total Northwest pear production to be 520,000 tons, down 22% from 2023.
Get the clearest, most accurate view of the truckload marketplace with data from DAT iQ.
Tune into DAT iQ Live, live on YouTube or LinkedIn, 10am ET every Tuesday.
The USDA forecast says Oregon pear production, at 200,000 tons or 8,700 truckloads, is down 15% from last year; total Washington pear production, at 185,000 tons, is down 31% from 2023. Tianna DuPont, a tree fruit extension specialist with Washington State University, said that Wenatchee-area pear growers experienced cold temperatures in mid-January this year, resulting in winter damage. She added that the damage is variable through the valley, but growers expect about half a crop in the Wenatchee River Valley this year.”
Market Watch
All rates cited below exclude fuel surcharges, and load volume refers to loads moved unless otherwise noted.
This week, let’s focus on New York State, the second-largest apple-producing state in the country behind Washington. It produces an average of 29.5 million bushels annually, equivalent to just over 27,000 truckloads. About 53% of all New York apples are sold fresh and ready to eat, while 47% are processed into juice, cider, canned products, and other processed apple products. The apple harvest season is underway and usually occurs between late summer and late October, with peak truckload shipments occurring in mid-October, according to the USDA.
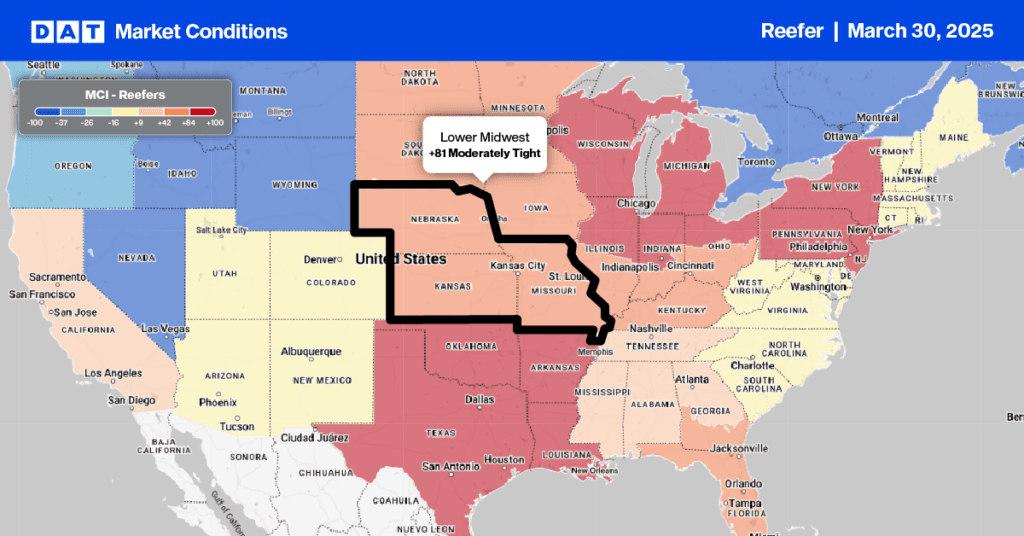
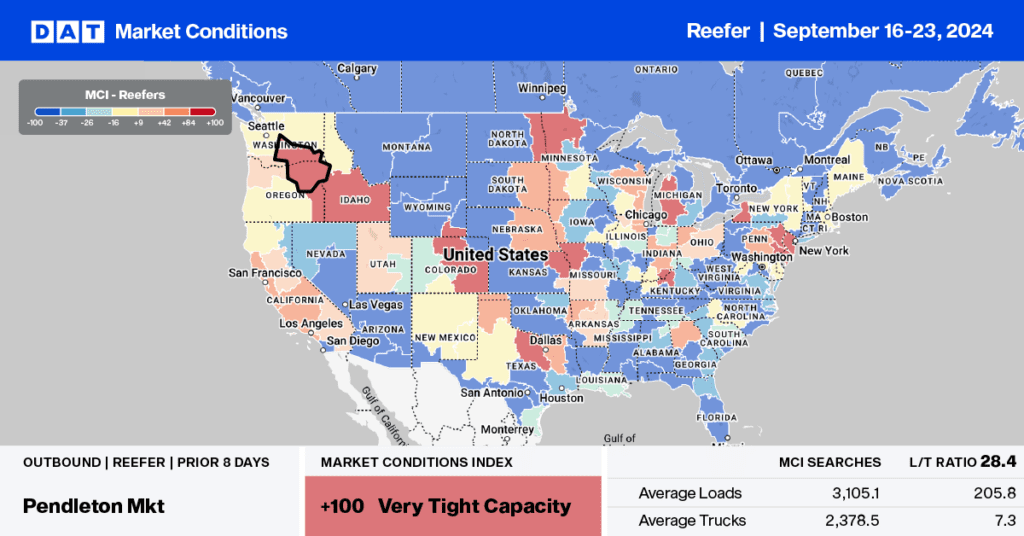
We are four weeks away from peak shipping, and truckload volumes are already 44% ahead of last month. According to DAT’s Market Condition Index (MCI), truckload capacity in Buffalo has been very tight in the last week and is forecast to remain so this week. On the high-volume lane between Buffalo and Augusta, ME, capacity is starting to tighten, with linehaul rates up 20% year-over-year, on a 61% higher volume following last week’s surge in reefer truckload demand.
Load-to-Truck Ratio
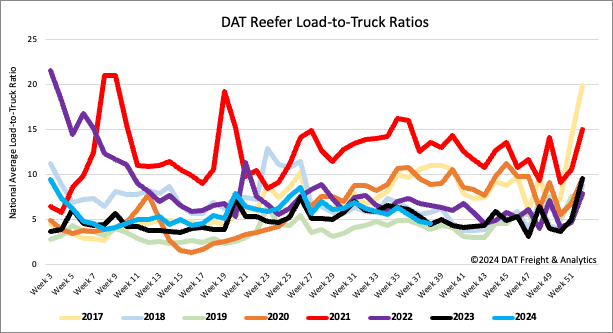
Reefer load post volumes remained around 35% lower than the long-term average for Week 37, weighed down by lower USDA national produce volumes during the summer-to-fall produce season transition. Carrier equipment posts decreased by 7% w/w but remained 5% lower than the long-term average. As a result, the reefer load-to-truck ratio (LTR) decreased by 7% to 4.51, almost identical to last year.
Spot rates
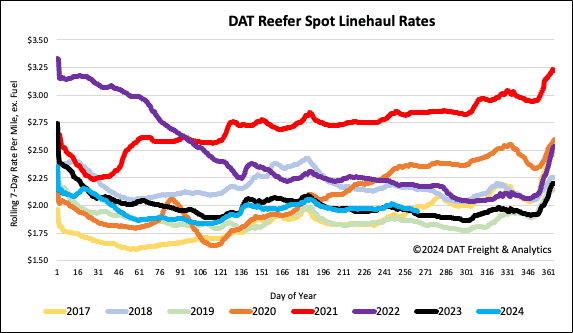
After remaining around the $2.00/mile mark for the past ten weeks, reefer linehaul rates slid back last week, dropping by $0.02/mile to a national average of $1.97/mile. The national average for last week is $0.03/mile higher than last year, and the long-term average for Week 38, which does not include the years affected by the pandemic. At $1.97 per mile, reefer spot rates are $0.02/mile lower than the three-month trailing average.