For the fourth time, the heaviest gourd in the world went to defending champion Travis Gienger from Anoka, Minnesota, at the 52nd World Championship Pumpkin Weigh-Off in Half Moon Bay, California. Weighing in at 2,471 lbs (1,120 kg) last week, this year’s monster pumpkin was just eight pounds lighter than last year’s world record-breaking pumpkin, weighing 2,479 lbs.
Get the clearest, most accurate view of the truckload marketplace with data from DAT iQ.
Tune into DAT iQ Live, live on YouTube or LinkedIn, 10am ET every Tuesday.
First place receives the world’s biggest prize of $9 per pound or $22,329, plus the Safeway World Championship Pumpkin Weigh-Off is offering a special $30,000 mega-prize for this year’s event. The second place pumpkin from Santa Rosa, CA, weighed in at 2,465 lbs, followed by another California-grown gourde, weighing in at 2,390 from Napa, CA. Farmers from across the country compete for first prize in conjunction with the Half Moon Bay Art & Pumpkin Festival every year. Growing a world-record-sized pumpkin, like the 2,741-pound behemoth, typically takes 4 to 6 months, beginning in the late spring or early summer, when seeds are planted.
Market Watch
All rates cited below exclude fuel surcharges, and load volume refers to loads moved unless otherwise noted.
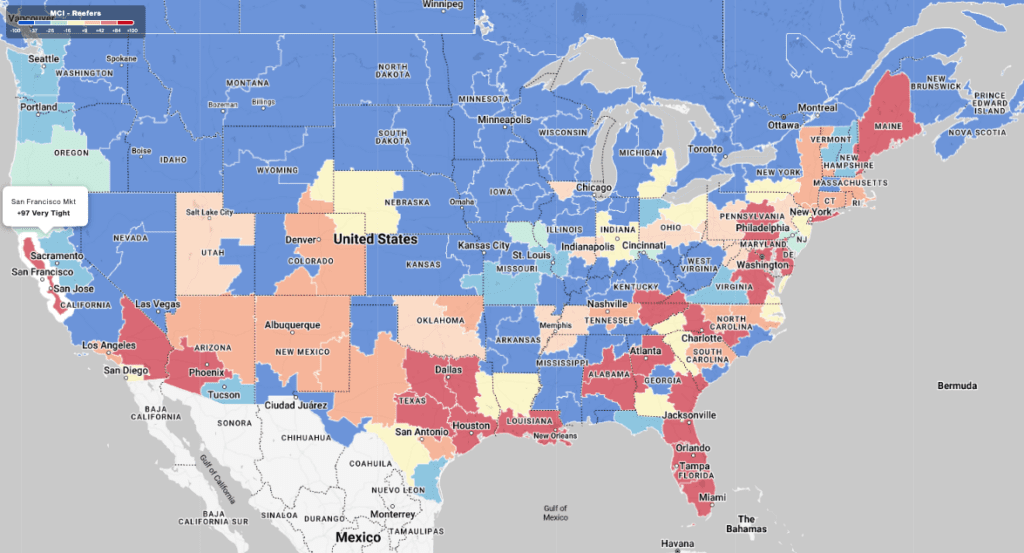
This week, we focus on refrigerated exports in the San Francisco freight market, home to Oakland, CA, the leading export port. According to the latest export data from IHS Markit/PIERS, Oakland accounted for 15% of refrigerated exports in August, followed by Jacksonville (11%), Tacoma (10%), Savannah (9%), and Los Angeles (7%). The top 5 ports accounted for just over 50% of containerized exports in the first half of this year.
Pork was the top commodity export, accounting for 19% of exports, followed by beef (9%) and citrus (8%). Compared to August last year, export volumes were 14% lower overall, mainly due to a 26% year-over-year (y/y) decrease in meat exports. Citrus, the second-highest export in Oakland, increased by 33% y/y, followed by cheese exports, up 38% y/y. Inbound reefer truckload volumes are trending around 16% higher y/y, while inbound truckload capacity is slightly tighter than last year. Inbound spot rates are up 3% y/y.
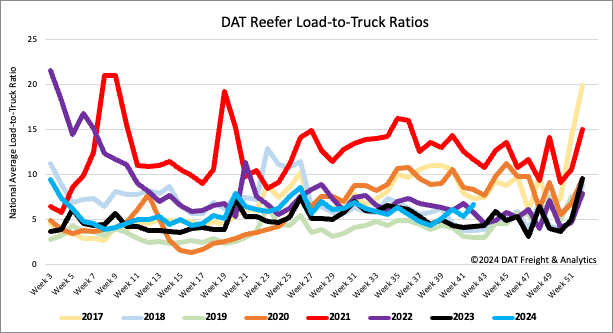
Load-to-Truck Ratio
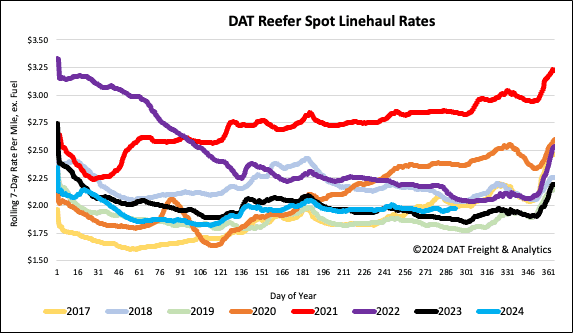
National reefer load postings experienced a significant surge last week, rising by 18% week-over-week and 24% year-over-year. This increase was partly driven by higher USDA produce volumes in California, which climbed by 5% week-over-week. However, postings for carrier equipment decreased by 7%, leading to a 26% increase in the reefer load-to-truck ratio (LTR), which now stands at 6.70. This figure is 60% higher than last year and 34% above the long-term average for Week 42.
Spot rates
The national average reefer linehaul rate increased by $0.03/mile, paying carriers an average of $1.99/mile, $0.10/mile higher than last year. Boosted by the rebuilding and restocking efforts in the Southeast post-hurricanes Helene and Milton, regional outbound spot rates jumped by $0.20/mile to $2.10/mile. In contrast, inbound reefer rates into Florida surged by $0.20/mile to $2.86/mile, the highest since 2016, excluding 2020 and 2021.
On the top reefer lane between Atlanta and Lakeland, where Hurricane Milton made landfall, volumes doubled last week, leading to a $0.35/mile increase in spot rates, averaging the highest in 12 months at $3.32/mile.