Hurricane Milton devastated Florida’s produce farmers, leading to significant economic losses and agricultural damage. The storm, which made landfall on October 9, 2024, as a Category 3 hurricane, swept across central and western Florida, damaging 51 counties. The total agricultural damage from Milton alone is estimated at $1.5 billion to $2.5 billion, with crops such as strawberries, melons, blueberries, and tropical fruits experiencing severe losses. These damages were compounded by flooding, high winds, and saltwater intrusion, affecting critical infrastructure like irrigation systems and greenhouses.
Get the clearest, most accurate view of the truckload marketplace with data from DAT iQ.
Tune into DAT iQ Live, live on YouTube or LinkedIn, 10am ET every Tuesday.
According to the latest USDA data, truckload shipments of produce are almost 80% behind last year. Watermelons, representing 28% of year-to-date (YTD) volume, trailed last year by 14%, followed by tomatoes (19%), which were 84% lower at the start of November. Usually, at this time of the year, truckload carriers move just over 5,000 truckloads of produce weekly; this year, it’s around 1,000 loads. Peak produce season won’t be until May next year in Florida, and even though there’s plenty of time to recover, Hurricane season is not over until the end of November.
Market Watch
All rates cited below exclude fuel surcharges, and load volume refers to loads moved unless otherwise noted.
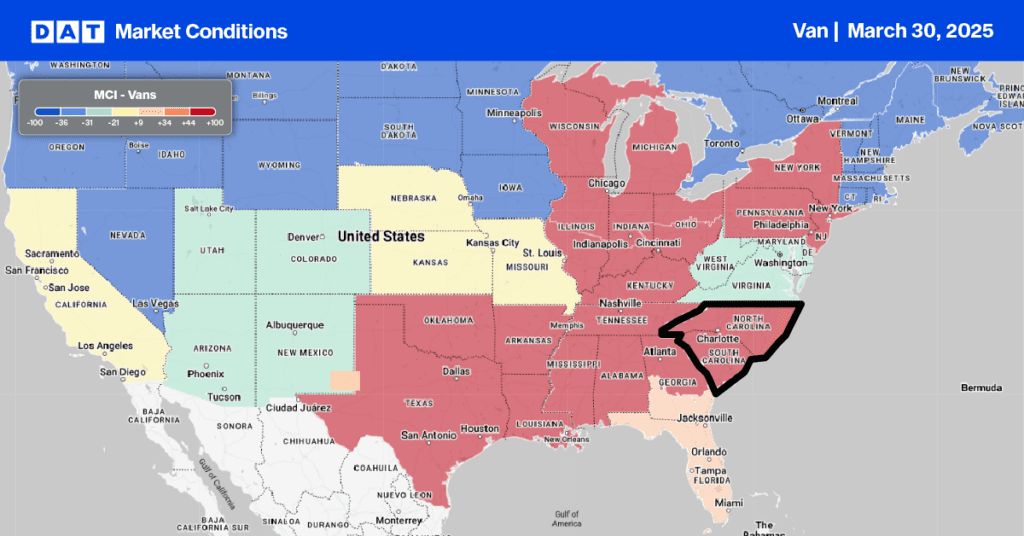
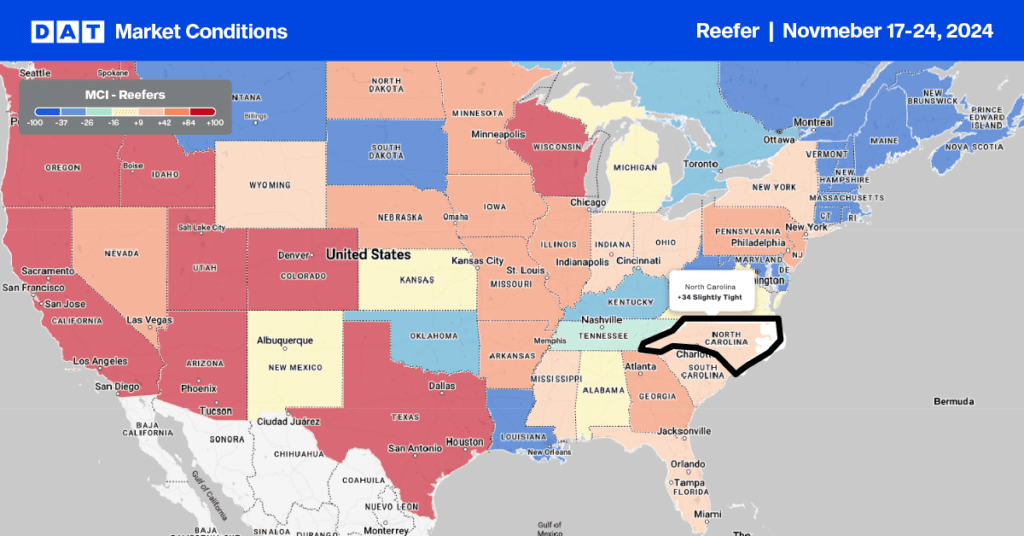
This week, we focus on the North Carolina market, which is the second-largest producer of fresh turkeys and Christmas trees annually. The weeks before Thanksgiving typically see outbound volumes surge; last week, volumes were up 28% w/w and 24% m/m. Truckload capacity is starting to tighten for outbound loads; spot rates have increased by $0.16/mile (8%) w/w to an average of $2.07/mile.
The highest-volume outbound lane is Raleigh to Lakeland, where volumes were up 28% last week, pushing spot rates up by $0.04/mile to $2.73/mile. Raleigh to Miami, the number two lane, saw volumes increase by 3% w/w while ample available capacity saw spot rates drop $0.05/mile to $2.54/mile.
Load-to-Truck Ratio
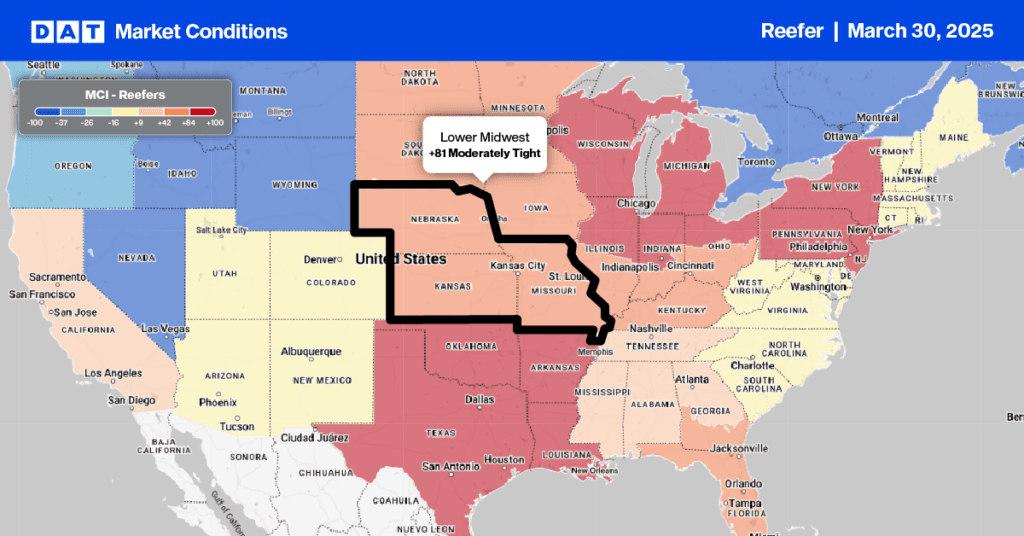
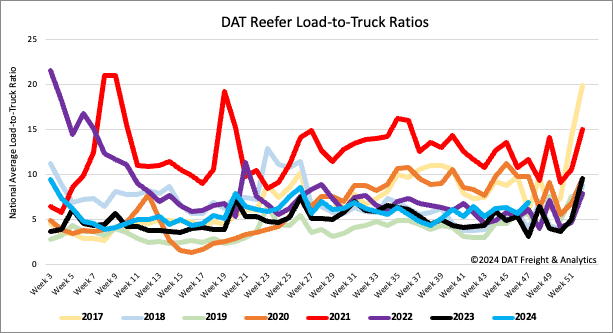
Reefer spot market load posts bounced back last week after three successive weeks of declines, following last week’s 8% increase. Reefer capacity tightened following the 11% w/w decrease in carrier equipment posts on our load board. Last week’s reefer load-to-truck ratio (LTR) stands at 6.84, up 21% w/w.
Spot rates
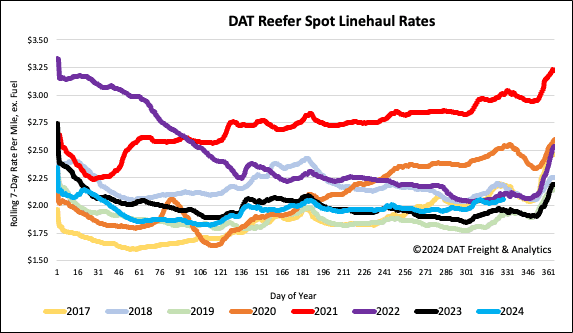
Reefer rates continued to heat up ahead of Thanksgiving this week, following last week’s $0.03/mile gain and rising $0.09/mile in the last month. At $2.06/mile, reefer linehaul rates were $0.09/mile higher than last year and $0.04/mile lower than in 2022. Reefer linehaul rates are around $0.07/mile higher than the three-month trailing average. Loads moved were up 6% last week and 16% last month.
