The annual “Escort to Arlington,” known as the country’s longest veterans parade, will kick off on Saturday, December 7, 2024. The official route, which can be viewed online, will travel down the East Coast, stopping at schools, memorials, and other locations to promote the year-round mission to remember the fallen, honor those who serve, and teach the next generation about the value of freedom.
Get the clearest, most accurate view of the truckload marketplace with data from DAT iQ.
Tune into DAT iQ Live, live on YouTube or LinkedIn, 10am ET every Tuesday.
The Escort to Arlington has grown to include 14 tractor-trailers from companies such as Baylor Trucking, Budd Van Lines, Saia LTL, Schneider National, Witte Bros. Exchange, Inc., Page ETC Transportation, Delhaize Transportation LLC (DBA Hannaford Supermarkets), American Trucking Associations – Workforce Heroes, Cargo Transporters, Inc., Prime Inc., Brown Dog Carriers, Walmart Transportation, Interstate Van Lines, and H.O. Wolding, Inc. (DBA Bison Transport USA). Additionally, Load One Carriers will again act as the ceremonial wreath transporter for the week.
What began over 30 years ago as a pilgrimage by a Maine wreath maker in a single truck delivering 5,000 wreaths to Arlington National Cemetery as a gesture of thanks has evolved into a year-round mission to Remember, Honor, and Teach. National Wreaths Across America Day ceremonies will occur at more than 4,800 participating locations nationwide on Saturday, December 14, 2024.
Market watch
All rates cited below exclude fuel surcharges, and load volume refers to loads moved unless otherwise noted.
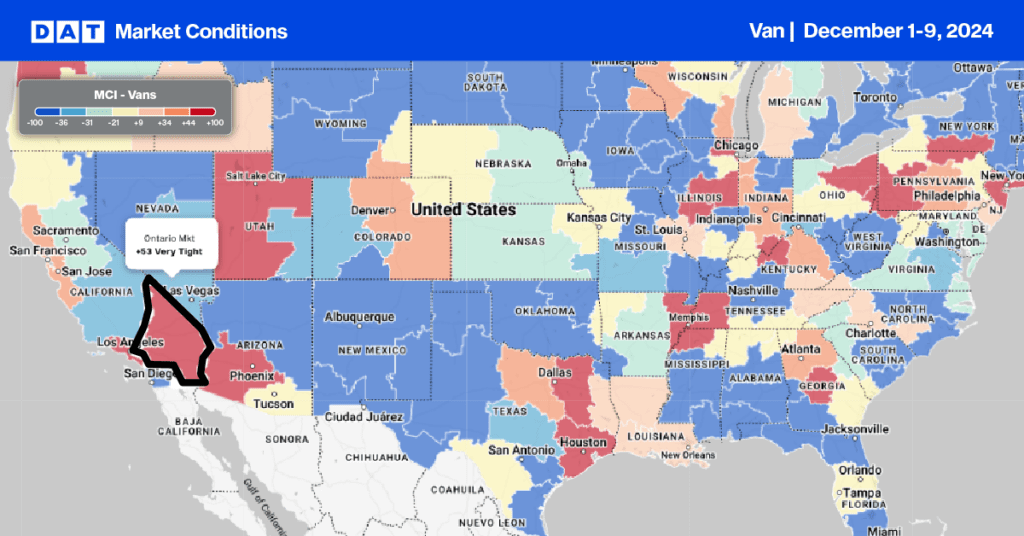
This week, we focus on the Ontario market, or the ‘Inland Empire’ as it’s known in California. This market is known for warehousing, logistics, manufacturing, and retail due to its proximity to major transportation corridors and ports connected by significant interstates (I-10, I-15, I-215). The “Inland” part of the name is derived from the region’s location, generally about 60 miles (97 km) inland from Los Angeles and the Pacific Ocean. Initially, this area was called the Orange Empire due to the acres of citrus groves that extended from Pasadena to Redlands during the first half of the 20th century.
In freight terms, Ontario rivals volumes from neighboring Los Angeles, and combined, they account for 65% of California’s outbound truckload volume. Both markets receive around a third of international containerized imports each month. Imports in Los Angeles are up 25% year-over-year (y/y), contributing to the 8% higher truckload volume the region reports compared to last year. The threat of more tariffs on imports is expected to see even higher volumes enter the region in December and January, resulting in a further tightening of truckload capacity. Outbound linehaul rates are already 13% higher than last December.
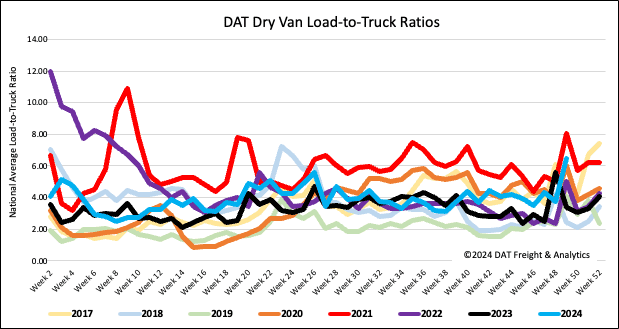
Load-to-Truck Ratio
Load post volumes surged last week as the market caught up from the short workweek before Thanksgiving. The dry van load post volume decreased by 14% compared to last year’s post-Thanksgiving week. Carrier equipment posts were 26% lower over the same timeframe, resulting in a dry van load-to-truck ratio (LTR) of 6.50, 16% higher than last year’s LTR of 5.59.
Linehaul spot rates
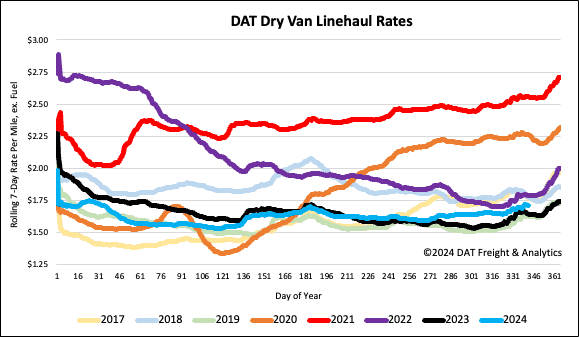
Even though the volume of loads moved increased by 6.4% last week, they’re just under 3% lower than last year’s post-Thanksgiving week. The ongoing exodus of small carriers was evident as available capacity tightened, resulting in a $0.01/mile increase in the national average dry van linehaul rate. At $1.72/mile, spot rates are $0.07/mile higher than last year and $0.08/mile lower than 2022.
On DATs’ Top 50 lanes, based on the volume of loads moved, carriers were paid an average of $2.06/mile, up $0.01/mile w/w and maintaining the $0.34/mile spread over the national 7-day rolling average spot rate. Dry Van linehaul rates are almost $0.07/mile higher than the three-month trailing average.
