The volume of outbound dry van truckloads in Ohio has grown by almost 23% in the last year; in contrast, inbound loads have surged by just over 40%. Ohio is within 500 miles of 60% of the U.S. and Canadian populations, making it a critical hub for regional and national freight movements. Major cities like Columbus, Cleveland, Cincinnati, and Toledo are key freight hubs. Proximity to manufacturing regions, agricultural centers, and retail distribution networks has boosted truckload demand.
Get the clearest, most accurate view of the truckload marketplace with data from DAT iQ.
Tune into DAT iQ Live, live on YouTube or LinkedIn, 10am ET every Tuesday.
Logistics Park Ohio (LPO), the brainchild of NorthPoint Development in North Baltimore, Ohio, is a great example of the expansion of the market. Located just off I-75, about 20 minutes north of Findlay and 40 minutes south of Toledo, LPO is immediately adjacent to the CSX Northwest Ohio Intermodal Terminal that opened eight years ago. LPO plans to do what it’s already accomplished for Northwest Ohio in Kansas City and Dallas-Fort Worth: Build a logistics hub that is a potential game-changer for industrial supply chains in the Greater Midwest.
Ohio’s strong manufacturing sector (automotive, steel, chemicals) generates substantial freight volume, requiring raw materials and shipping finished goods. In addition, the growing number of distribution centers for major retailers like Amazon and Walmart is driving truckload demand, especially for consumer goods.
Market watch
All rates cited below exclude fuel surcharges, and load volume refers to loads moved unless otherwise noted.
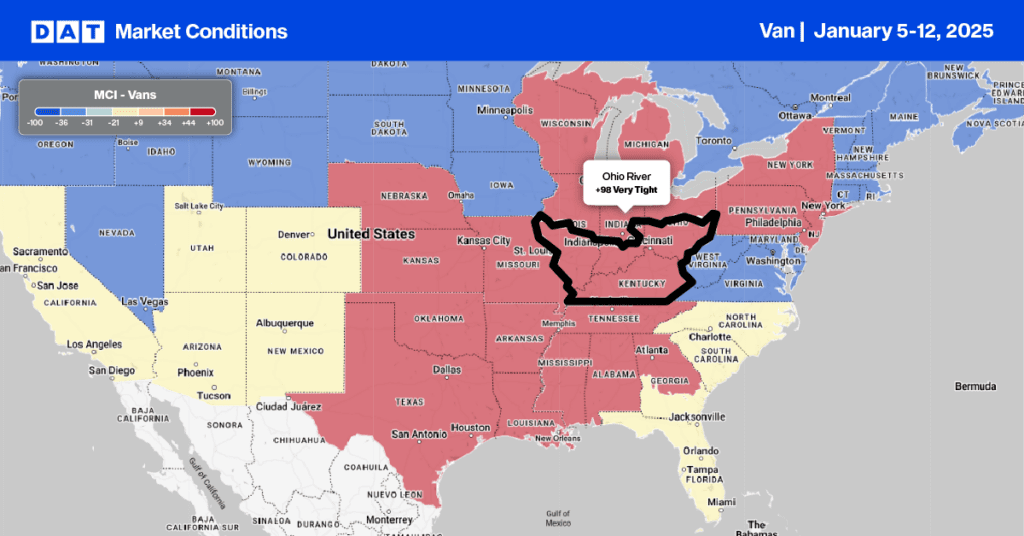
This week, we focus on the Ohio River freight market, where Winter Storm Blair wreaked havoc on roads and infrastructure last week. The storm impacted major interstates, bringing heavy snowfall, ice, blizzard conditions, and dangerously cold temperatures. The region includes parts of Ohio, Kentucky, Indiana, West Virginia, and Pennsylvania, and its manufacturing base is diverse and deeply rooted in heavy industry, automotive production, steel, and chemicals.
Outbound spot rates increased by $0.10/mile last week to a regional average of $2.39/mile, while inbound regional loads increased by $0.10/mile to $1.90/mile. Outbound rates jumped by $0.13/mile in Chicago and Joliet to a combined average of $2.50/mile. Indianapolis outbound rates increased by 7% or $0.15/mile to $2.25/mile, $0.17/mile higher than last year. Outbound Kentucky rates increased by $0.06/mile to $2.26/mile, almost 10% higher than last year.
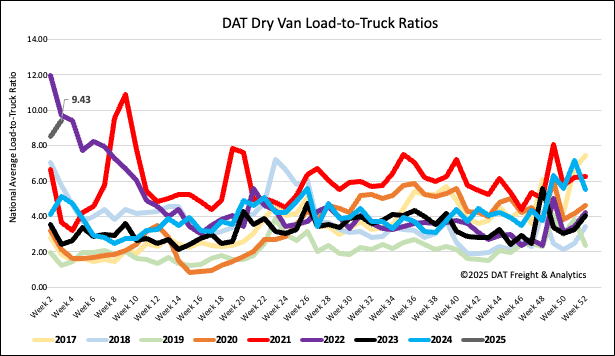
Load-to-Truck Ratio
With most participants returning to the freight market during a severe weather week, load post volumes ended the week 7% higher than last year as truckload capacity decreased due to Winter Storms Blair and Cora. Equipment posts were down substantially as carriers were delayed and sidelined due to road closures and power outages. As a result, last week’s dry van load-to-truck ratio (LTR) was 9.43, 11% higher than last week and more than double Week 2 last year.
Linehaul spot rates
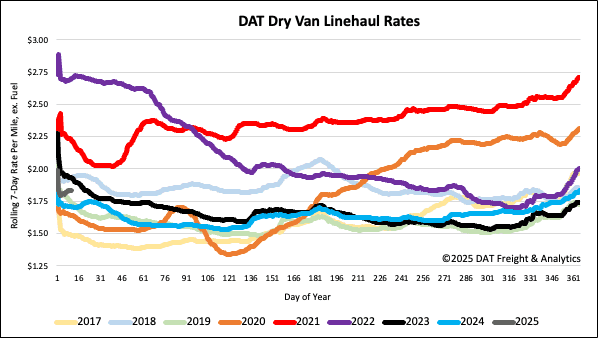
The national average dry van linehaul rate ended last week at $1.84/mile, up $0.04/mile. At $1.84/mile, spot rates are $0.13/mile (7%) higher than last year. On DATs’ Top 50 lanes, based on the volume of loads moved, carriers were paid an average of $2.18/mile, down $0.02/mile w/w and $0.34/mile higher than the national 7-day rolling average spot rate.
