As with Valentine’s Day, when truckloads of flowers start moving two weeks prior, this week begins the peak shipping season ahead of Mother’s Day on May 11. Large truckload carriers have already implemented a temporary 10% holiday surcharge that will apply to all products shipped outbound from Florida with a ship date of April 24, 2025, through May 7, 2025. On the West Coast, a temporary 20% holiday surcharge will apply to all products shipped outbound from California with a ship date of April 24, 2025, through May 7, 2025.
Get the clearest, most accurate view of the truckload marketplace with data from DAT iQ.
Tune into DAT iQ Live, live on YouTube or LinkedIn, 10am ET every Tuesday.
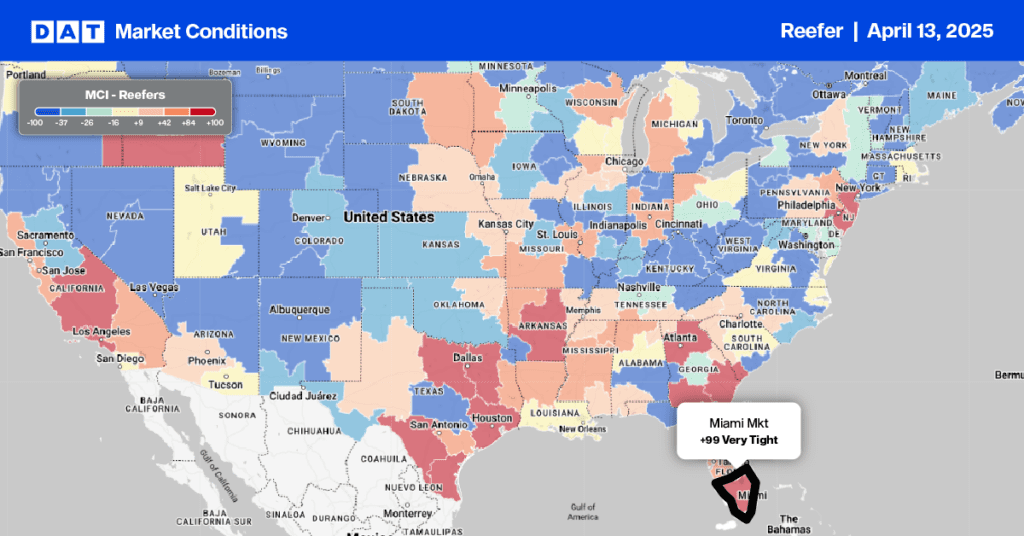
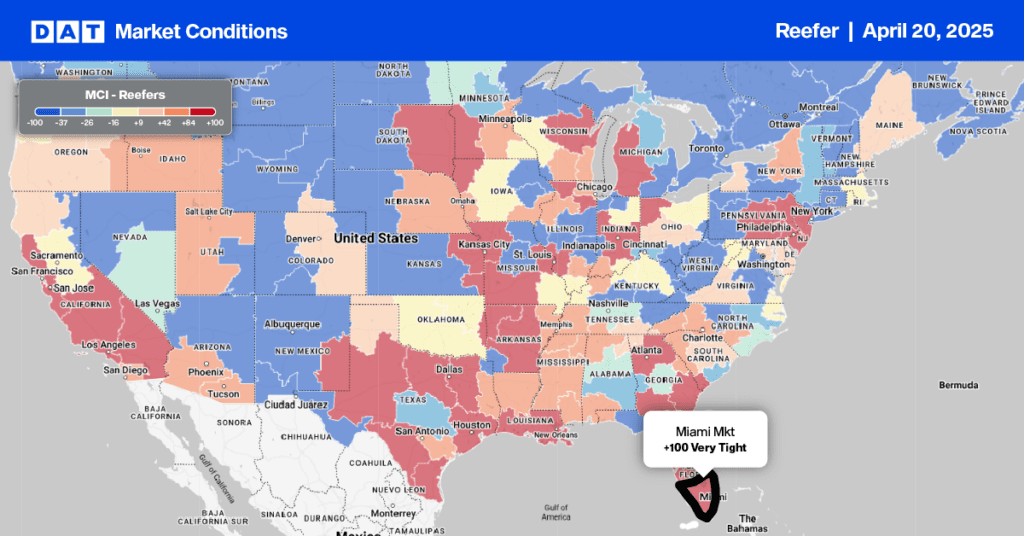
Most activities center in Miami, just 3.5 hours of flying time from where most Mother’s Day roses and carnations are grown in countries like Colombia and Ecuador, major exporters of roses and carnations. According to the USDA, in 2024, 63% of rose and carnation stems were imported from Columbia, 35% from Ecuador, and 1% from Guatemala. 88.8% landed at Miami International Airport (MIA) before being trucked all over the U.S. and Canada. An additional 7.7% were shipped via West Coast airports, including Los Angeles (5.9%) and San Diego (1.8%).
Behind the scenes are dozens of 747 jumbo jet air freighters loaded with flowers arriving from South America at MIA daily. Global floral supply chains follow a south-north pattern – fresh cut flowers in Europe arrive from South America from Kenya (the largest producer of roses in the world). In North America, flowers mostly come from South America. All are close to the equator, where growers have natural light all year round, reducing the need for artificial illumination.
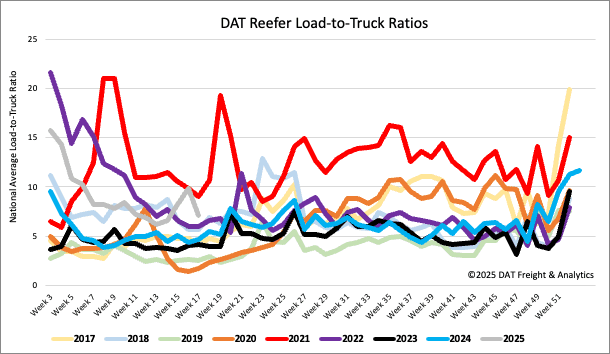
Load-to-Truck Ratio
Reefer load post volumes increased by 7% despite a 5% drop in North American produce volumes last week. Following the surge in Mexican produce imports since the start of February, produce volumes on the southern border dropped by 4% last week, driven by a 15% w/w decline in tomato imports, now subject to a 21% tariff beginning July. The California season has been off to a slow start; volumes were up 2% last week but are 33% lower year-to-date. As a result of higher load post volumes, the national reefer load-to-truck ratio (LTR) was up 12% last week to 7.75.
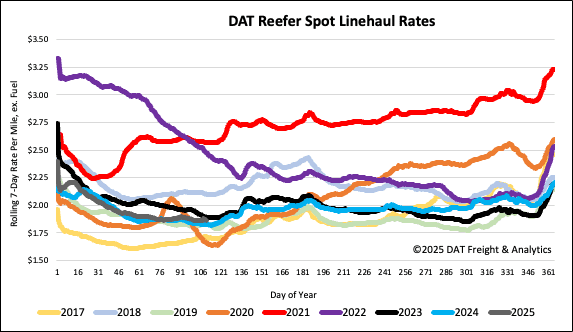
Spot rates
Available reefer capacity remained mostly flat last week, with the national average reefer spot rate remaining slightly above $1.88/mile on a 2% higher volume of loads moved. Reefer spot rates are $0.04/mile higher than last year and $0.03/mile higher than 2019.