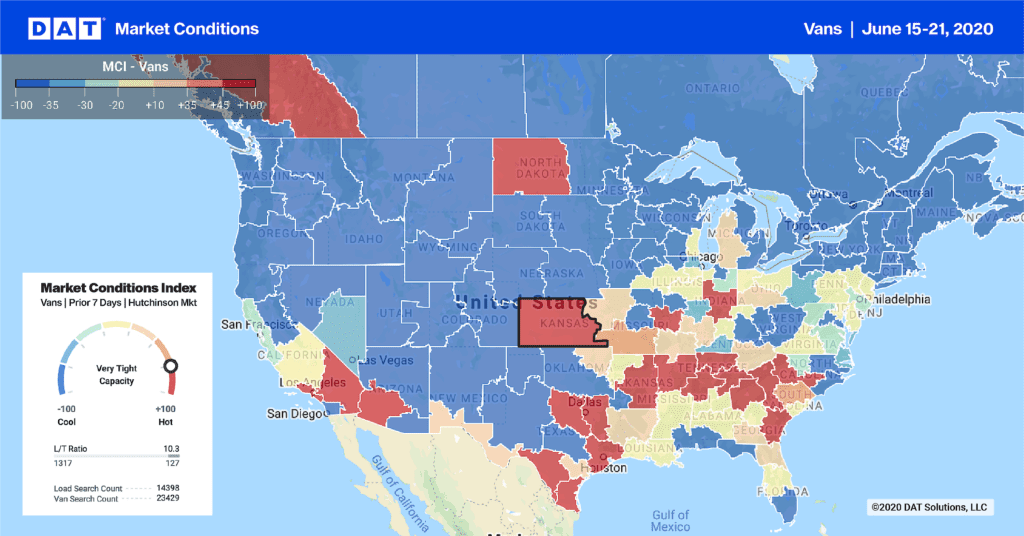
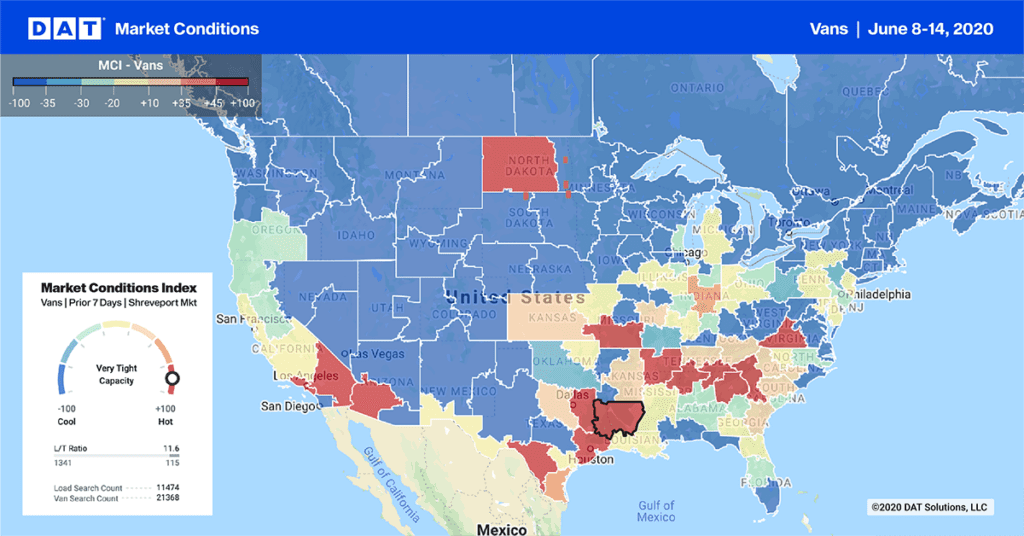
 We report on national average rates every week in Trendlines. but that 35,000-foot view seldom tells the whole story.
I wish I could share all the rich, detailed information with you — I know it would have helped me to have such a resource when I was a pricing analyst at a for-hire carrier, or when I held the same position at a large 3PL company.
I’ll have to confine myself to a brief analysis, however, due to the constraints of a blog post, but subscribers to DAT RateView can easily duplicate my research, or contact DAT for help constructing their own custom reports.
Some contradictory data had me puzzled this week:
VAN: National averages tell us that van rates are mostly rising, possibly to a new peak, but capacity is loosening at a national level. That makes no sense — when there is more truck capacity available, rates should drop. The answer is that national trends are just a composite of a bunch of local trends. If half the lane rates rise a lot, and just as many lane rates drop — but not very much — the national rate rises. Meanwhile, in the areas where lane rates fell, there were a lot of trucks stuck in quiet markets without much outbound freight. So those carriers are posting trucks — which is something they prefer not to do. Pressure is intense for vans in the Southeast*, partly due to produce season. Some produce can travel in vans, and any carrier with temperature-controlled trailers will deploy them to haul high-paying freight during this season, leaving van trailers idle.
REEFER: We are heading into the peak produce season, when harvests in California typically cause reefer demand to skyrocket. Rates in California are heating up, but the growing season is also extended in Florida by the addition of new crops, so demand for reefers is off the charts on the opposite side of the country. At the same time, demand is slack in Idaho and the Upper Midwest, so rates in those markets are mostly moderating or declining.
FLATBED: National averages are stable for flatbed rates, demand and capacity, but individual markets are incredibly tight for trucks. To pick just one example, the lane rate from Houston to Oklahoma City is 61¢ above the annual average right now, and it’s also significantly higher than the prevailing contract rate. When spot market rates exceed contract rates, that’s a clear indicator of capacity pressure, as I discussed in last week’s blog post. The outbound load-to-truck ratio is 64.6 from Houston, which far exceeds the current national average of 34.2 for flatbeds.
National averages are useful as a generalized barometer, but if you want to really understand the dynamic pressures and trends that shape your business every day, go local.
* Note: We now ask for your name and email address before you view regional rates pages on DAT Trendlines for the first time. There is still no charge for Trendlines, and you are welcome to subscribe to our free, weekly email updates, as well.


