Spot market freight volume is soft, and capacity is loose. Large truckload carriers are raising their prices, but spot market rates are down. There are more freight brokers entering the market than there were last year. These and other emerging trends could be opportunities in disguise. Understand and leverage these market forces, and grow your business in the second half of 2015.
Capacity is much looser now than it has been in recent years. This is clearly illustrated in DAT Hot Market Maps, below, for July 2013, 2014 and 2015. Note the relative lack of capacity pressure in July 2015 (right.) July is typically a slow month – but not this slow. Compare last month to the extreme pressure of July 2014 or even the more typical scenario of July 2013. Grey represents a low load-to-truck ratio in a key market area, and the deepest red represents more than 5 load posts for every truck post on DAT Load Boards.

Freight availability declined on the spot market in July. It is typically a slow month, but demand fell even more than usual, so it is below 2013 levels for the first time this year. Volume remains higher than every previous year, however, so the picture is not totally bleak.
Freight transportation is a leading economic indicator, and the latest reports support the trends we see in our industry: factory production is down, new oil and gas drilling is stalled, coal and steel are declining.
The service sector is growing as a portion of GDP. Services don’t generate as much freight as manufacturing, but they contribute to employment, which seems to be recovering.
More jobs and lower fuel costs can put more money back in consumers’ pockets, so a lot of economists and financial analysts — including Donald Broughton of Avondale Partners — predict that those consumers will spur the economy in the second half of this year. If retailers agree, they will start building inventory very soon. We’ll know more in a few weeks.
The largest trucking fleets have been hauling more freight, meanwhile, according to the American Trucking Associations For-Hire Tonnage Index (not seasonally adjusted.) That means there is less “exception freight” available for the spot market.
These large, public carriers are spending more to attract and retain drivers, and they bought a lot of new trucks in 2014 – a banner year for Class 8 truck sales. The end result is a 7.4% increase in capacity, according to the Journal of Commerce’s Q2 Truckload Capacity Index. While that was the highest reading since the start of the recession in Q4 2008, it’s still 11% below 2006 levels. So despite the capacity increase, large carriers are raising their rates.

Spot market rates rose faster than contract rates over the last two years, but that trend has now reversed. You can see in the graph, above, that there was only a 5¢ gap between spot rates and contract rates as recently as December 2014. That gap has widened since March. Contract rates continued to trend up in Q2, but spot rates have been declining. Last month, there was a 25¢ per mile difference between national average spot market rates and contract rates. This chart does not include the fuel surcharge, which has been declining steadily during the same period.

When the fuel surcharge is included, it is clear that carriers are being paid less per mile now than they were in 2014, and the total spot market rate has been on a steady, downward trend since January. Obviously, a big part of this decline was the change in the fuel surcharge, which plummeted from 48¢ per mile in July 2014 to 27¢ per mile now. Even though the fuel surcharge is not quoted separately from the line haul rate in the spot market, fuel has a big influence.
Looking ahead to the rest of 2015 and beyond, a handful of macroeconomic trends are likely to shape freight transportation and logistics. Fuel prices are continuing to decline, and they may go lower. The Federal Reserve is expected to raise interest rates next month, which would have a mixed impact on the economy. Consumer confidence is shaky, but an improvement could lead to a rebound in freight volume in Q4. No new regulations are poised to take effect for the rest of this year, even if legislation passes.
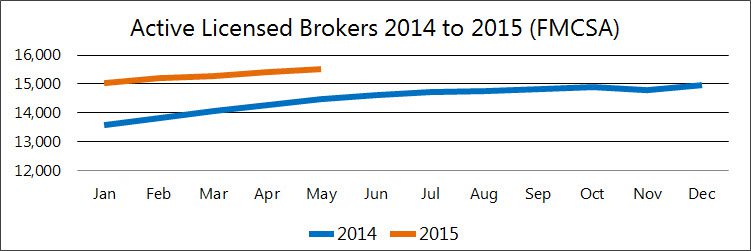
Whether those trends lead to an influx of freight or a change in capacity levels, the dynamic market conditions signal new opportunities for freight brokers and 3PLs. In fact, there are more licensed freight brokers every month, according to FMCSA records.

Meanwhile, the largest carriers are “becoming more selective about the freight they haul,” according to a recent article in Transport Topics. They may reject freight that does not mesh well with their routes or schedules. This creates opportunities for brokers and 3PLs. Contract rates are trending up, so broker/3PL-managed freight movements are increasingly price-competitive, too. This could be a great time to bid on new business with your current customers, and compete for new customers, to expand your market share.
Note: Reference rates are national averages from DAT RateView, for loads moved during those months. Contract rates are paid by shippers to their core carriers, and are based on actual freight bills. Spot market rates are paid by freight brokers and 3PLs to the carriers, and the average is based on actual rate agreements. DAT RateView includes detailed rate data for vans, reefers and flatbeds, on more than 65,000 point-to-point lanes across North America.

