Just over two years ago, U.S. consumers embarked on a spending spree that initially began with overstocking pantries with daily essentials and then quickly transitioned into buying record levels of physical goods for working, living, eating, and sleeping more at home. The pandemic changed many things in our daily lives but none more so than the supply chain, which is still damaged and even broken depending on who you talk to. One thing is for sure, though – the pandemic highlighted just how much we’ve become dependent on imports from overseas, with China being the dominant source of much of what we buy every day.
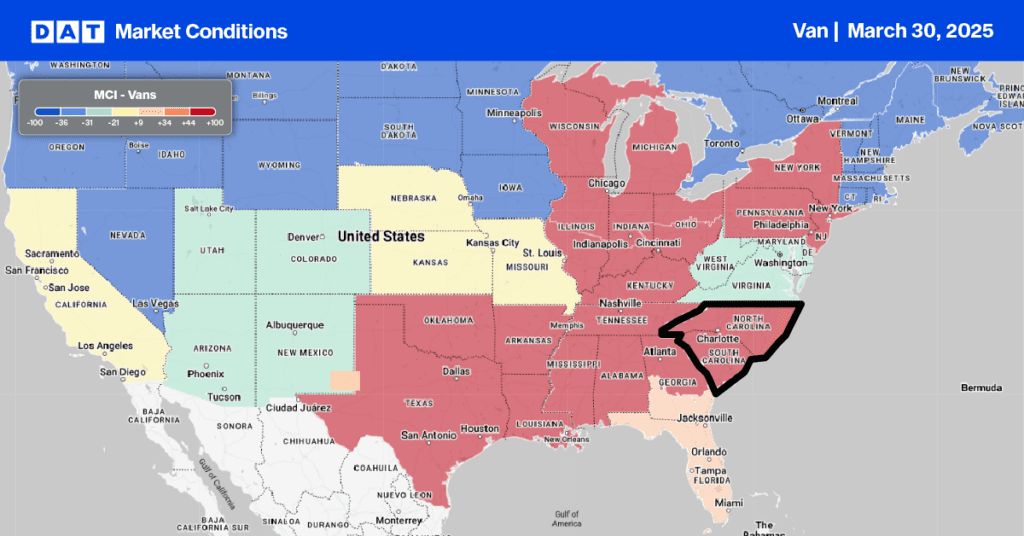
China accounted for 42% of all containerized imports last month according to PEIRS, an IHS Markit company. In fact, imports from Asia made up a whopping 68% of container volume in May with 60% landing on the West Coast of the U.S. alone. Of the 25 ports along the West Coast, just two, the Ports of Los Angeles and Long Beach, handle close to 80% of import volumes from Asia each month. Hence the massive and unprecedented port congestion we’ve been witnessing off Los Angeles since late 2020 and the incredible volume of truckload freight being shipped out of that market.
Get the clearest, most accurate view of the truckload marketplace with data from DAT iQ.
Tune into DAT iQ Live, live on YouTube or LinkedIn, 10am ET every Tuesday.
When will consumers slow down their spending spree?
Many assumed this would happen by the middle of last year. After all, how many more TVs, laptops, office desks and chairs, indoor exercise bikes, bicycles, and gym equipment can Americans buy? It turns out the answer is a lot – 149,541 more containers in May compared to April and 85,528 more compared to May last year to be precise. Furniture is by far the most popular commodity imported into the U.S. and in May there were 19,477 more containers delivered to our shores than last month. Even containerized import volumes of electronics in May were 943 TEU (twenty-foot equivalent unit) higher m/m.
Where do all the containers go?
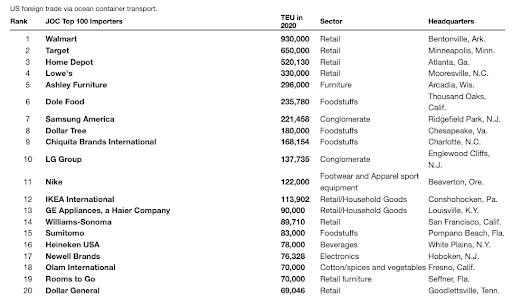
According to the Journal of Commerce (JOC), the top five U.S. importers were responsible for a collective 2.98 million TEU last year, accounting for 10.7% of total imports. The annual JOC Top 100 Importers report noted, “total containerized trade in and out of the United States rose 7.8% last year, as a 13.1% increase in import volumes more than offset a 3.1 percent decline in exports. Import gains were broad-based, with double-digit percentage growth in automobiles and parts, household goods, toys, and clothing as consumers emerging from social isolation thanks to COVID-19 vaccines continued to spend the majority of their money on goods, rather than services such as travel and in-person entertainment. Although they did not rise as rapidly as other commodities, imports of electronics and foodstuffs continued on their long-term growth trajectory, reflecting a growing US economy in which low unemployment and even lower interest rates drove strong consumer spending.”

There’s a common theme this year with the top importers
According to Prof. Jason Miller at Michigan State University, “discretionary spending, especially for home goods. LG and Samsung import large appliances and electronics products (e.g., TVs). Ashley Furniture Industries and Williams-Sonoma sell furniture and various home goods. Nike imports apparel and shoes. The Home Depot sells furniture, large appliances, etc. and Target sells furniture, electronics, and clothing”. These companies were all in the Top 10 importers that saw the greatest gain in the number of imported TEU in 2021 relative to 2020.


