Capacity is becoming more available, as small fleets have mostly adjusted to electronic logging device (ELD) and strict enforcement of the Hours of Service rules. Driver pay has risen steadily in the past year, so large fleets are able to attract drivers and keep more trucks on the road, effectively increasing capacity. Driver turnover remains high, so retention continues to be a pressing issue, especially for large fleets.
At the same time, new trucks are everywhere, which has caused the average age of trucks in service to decline. A new truck doesn’t need repairs or maintenance as often as even a 5-year old truck, so the new trucks may have as much as 4% greater availability, which translates to additional capacity.
Total economic demand, especially in the industrial economy, is still growing, but not at the same frenetic pace we saw in the first half of 2018.
The DAT Freight Barometers, and this proprietary method of weighing the balance between demand and capacity, predict both the direction and magnitude of changes in spot pricing. Further, the spot price trend is predictive of the contract price. We find the gap between the spot price and the contract price useful in assessing and predicting the margins reported by most of the large publicly held truck brokers, as well as the logistics divisions of asset-based carriers. We should note that the spot price was higher than the contract price earlier this year, but spot is now back below contract. This is a function of the both the increase in contract prices and a reduction in the spot price back to what we would consider a more “normalized” gap.
Dry Van Barometer
Although the current reading of 55.6 is not quite at the extreme levels of capacity tightness experienced in Q1, there are still more loads than trucks in most lanes in most parts of the country. More recently the Barometer has declined as capacity has re-entered the market both through increasing the actual number of trucks and by improving the asset utilization rates of the trucks already in service. The Barometer’s current level should enable carriers to achieve higher pricing in the 2019 bid season, but the increases won’t be as steep as they were in 2018.
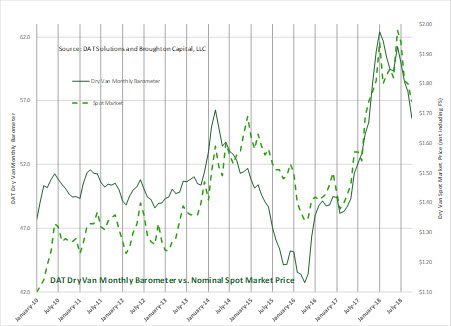
The DAT Van Freight Barometer is a reliable predictor of spot market rate trends, as illustrated in this graph of the Barometer with spot van line haul rates from 2010 through October 2018.
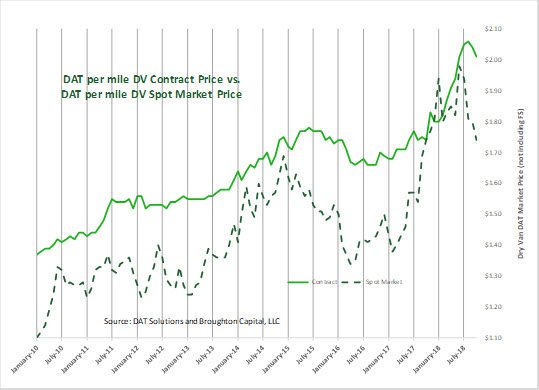
Sustained changes in spot market truckload rates, beyond seasonal adjustments, give advance warning on the direction of contract rates for dry van freight.
Reefer Barometer shows contract rates rising more gradually in 2019
At 57.3, the Reefer Barometer has been above 50 for 17 months in a row. As with the dry van segment, the current reading for reefers is not at the extreme levels of capacity tightness experienced in January (above 60) but there are still more loads than trucks in most lanes in most parts of the country. The latest adoptees of ELDs in the reefer industry are regaining some of the productivity that they lost initially, but they don’t often have the option to increase efficiency with “drop and hook” trailer operation. Reefer fleets tend to need at least some basic level of driver involvement, so they tend to have much lower trailer-to-tractor ratios — 1.5 to 1 instead of 2.5 to 1 for dry vans. That said, the current level of DAT Reefer Weekly Barometer is predicting stronger contract pricing in coming months and establishing a stronger consolidation pattern than either of the other two modes.
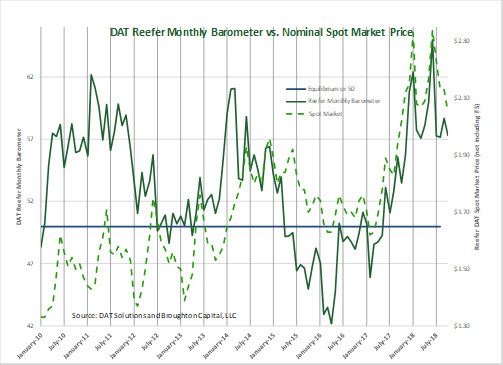
The DAT Reefer Freight Barometer indicates spot market rate trends, as shown in this graph of the Barometer and spot reefer line haul rates, with monthly averages from January 2010 through October 2018.
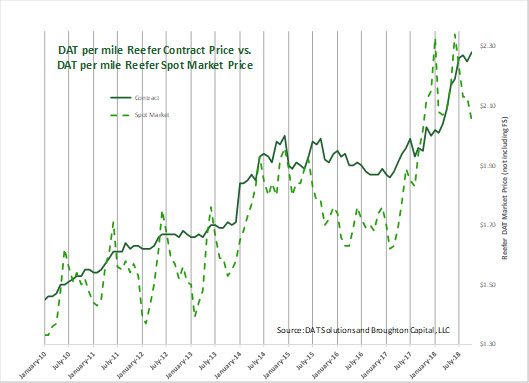
For reefers as well as vans, spot market rate trends anticipate changes in contract rates.
Flatbed Barometer
The metric for flatbeds came in at 59.1 in October, still trending down from the zenith record high of 113.0 established in May. Despite the recent decline, the DAT Flatbed Barometer has been well above equilibrium for 20 consecutive months, beginning in March of 2017 when crude oil prices rose above $50 a barrel and drove an increase in heavy industrial activity. The reduction in the corporate tax rate and increase in deductions for capital investments boosted the industrial economy further, and that strength has been buoyed by an oil price that makes fracking profitable in all parts of the U.S. For those reasons, we see the current level of flatbed activity as an indicator of ongoing expansion in the U.S. industrial economy, although the rate of growth has slowed since the first half of this year.
As with dry van and reefer, there is also a clear pattern where the DAT Barometer leads the spot price for flatbeds, and the spot price leads the contract price, as the following two graphs indicate.
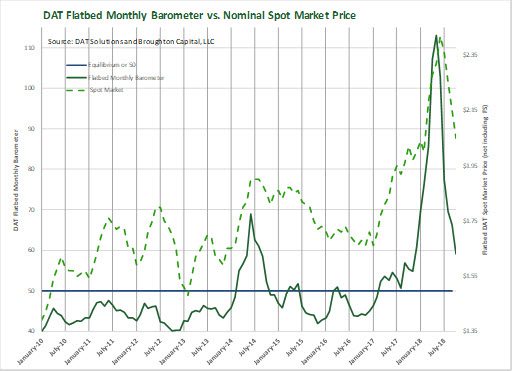
Spot market rate trends follow the DAT Flatbed Freight Barometer. This graph of the Barometer and spot flatbed line haul rates shows monthly averages from January 2010 through October 2018.
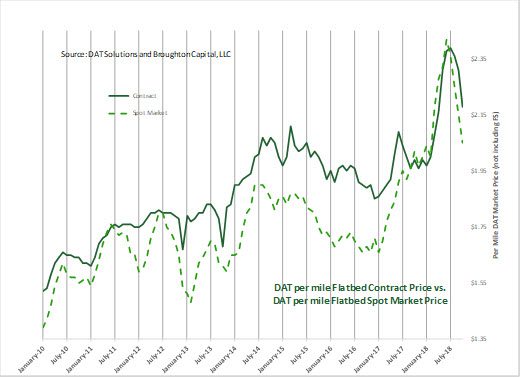
As with reefers and vans, spot market rate trends anticipate changes in contract rates for flatbed equipment.
Donald Broughton, Principal and Managing Partner of Broughton Capital, is a financial analyst with decades of experience in the transportation industry. Contact him at donald@broughtoncapital.com.

