The Federal Motor Carrier Safety Administration’s Drug and Alcohol Clearinghouse has been operational for nearly five years, with nearly 300,000 drug and alcohol violations reported since it began enforcing regulations at the start of 2020. Drivers flagged for violations in the Clearinghouse have been categorized as “Prohibited,” meaning they should not be permitted to drive.
Get the clearest, most accurate view of the truckload marketplace with data from DAT iQ.
Tune into DAT iQ Live, live on YouTube or LinkedIn, 10am ET every Tuesday.
Beginning Monday, November 18, Phase 2 of the Clearinghouse rule will take effect, further strengthening enforcement measures. Until now, roadside enforcement or motor carriers have been responsible for monitoring drivers through Clearinghouse’s required annual queries to ensure none are prohibited.
According to the FMCSA’s latest Clearinghouse report, updated through September 2024, approximately 178,839 Commercial Driver’s License (CDL) holders will lose their licenses as of November 18 due to being in prohibited status. The overall impact on truckload capacity appears limited for those who have previously complied with Clearinghouse requirements.
Market watch
All rates cited below exclude fuel surcharges, and load volume refers to loads moved unless otherwise noted.
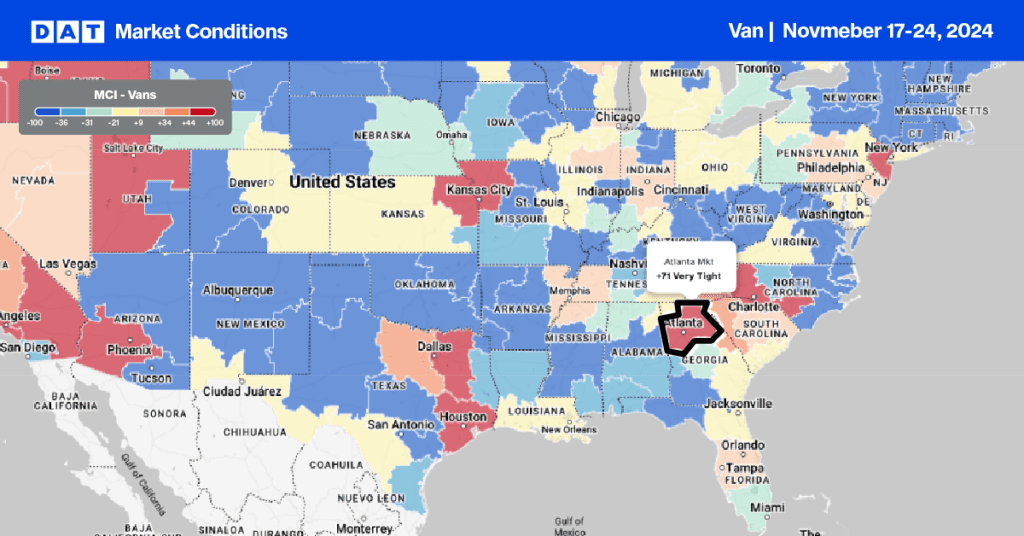
This week, we focus on the Atlanta market, the most extensive freight distribution in the Southeast. Atlanta is centrally located and within a two-day trucking distance of 80% of the U.S. population. Its location at the junction of major interstate highways, including I-20, I-75, and I-85, makes it an ideal hub for distributing freight. In addition, Atlanta Airport is one of the busiest in the world, with a substantial air cargo operation. Atlanta is also a central hub for freight railroads, including Norfolk Southern and CSX Transportation.
The Atlanta truckload spot market primarily services Florida, accounting for 13% of weekly outbound truckload volume. Atlanta to Lakeland consistently has the highest weekly volume, followed closely by Atlanta to Miami. On the Lakeland lane, volumes have dropped 39% in the last month, along with spot rates, which have decreased by $0.20/mile to $2.62/mile. Volumes on the Miami lane are 17% lower than last month, resulting in a 5% drop in linehaul rates. Both lanes reflect the volatility these lanes experienced following the disruption caused by Hurricane Milton, which made landfall in early October.
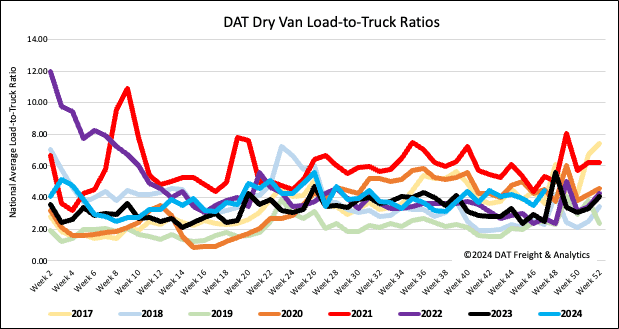
Load-to-Truck Ratio
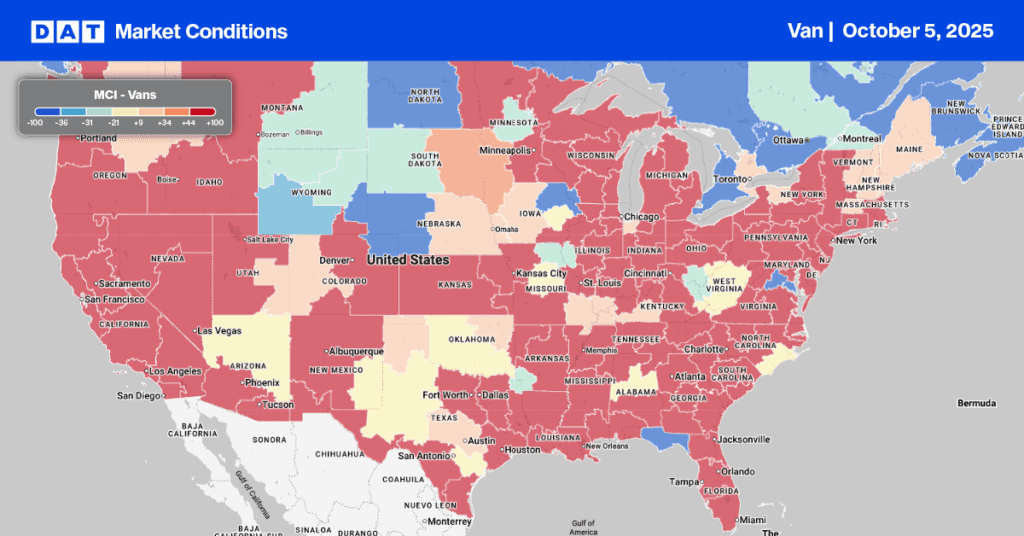
The volume of dry van load posts increased by 15% last week as shippers positioned inventory in retail markets ahead of the Thanksgiving break, which includes Black Friday and Cyber Monday sales events. Carrier capacity tightened in the spot market following last week’s 10% decrease in equipment posts, resulting in a 28% increase in the dry van load-to-truck ratio (LTR) to 4.46.
Linehaul spot rates
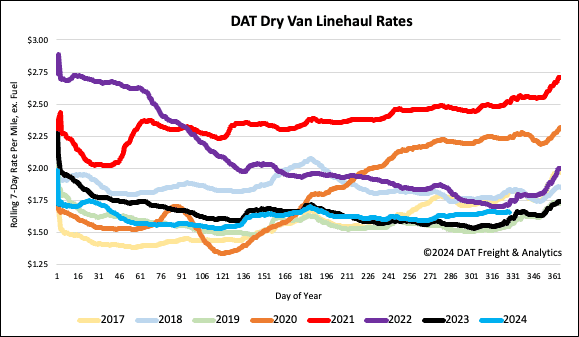
Even though the volume of loads moved increased by just over 6%, there was a slight shortage of available capacity to meet demand, resulting in a penny-per-mile increase in the national average dry van linehaul rates. At $1.67/mile, spot rates are $0.05/mile higher than last year and $0.06/mile lower than 2022.
On DATs’ Top 50 lanes, based on the volume of loads moved, carriers were paid an average of $1.98/mile, the same as the prior week and $0.31/mile higher than the national 7-day rolling average spot rates. Dry Van linehaul rates remained $0.03/mile higher than the three-month trailing average.
