Recent news of vessel and draft restrictions on the Panama Canal due to drought conditions has not affected most shippers — at least not yet — but the resulting queue of container ships waiting to transit the canal does bear watching for importers moving goods into the U.S. for the coming fall and winter seasons, according to Mike Angel from the Journal of Commerce. Drought has reduced the level of Gatun Lake, which provides the freshwater for the canal’s locks, to about 79 feet, compared with a five-year average of 85 feet, reducing vessel draft levels from 50 to 44 feet. Two weeks ago, the new containership and the largest transit through the Panama Canal, the Ever Max, highlighted what this means to shippers. The vessel had to offload 1,400 TEU (twenty-foot equivalent units) to allow safe passage through the lock, creating additional delays as the excess containers were shipped by rail before reloading.
Over the past year, DAT Freight & Analytics has observed a change in coastal import patterns, with a higher number of imports arriving at the East Coast than the West Coast. A significant portion of this shift routes the goods through the drought-affected Panama Canal before reaching ports along the Gulf and East Coast.
So far, this trend has continued, although a shift of imports back to the West Coast for imports is something that drayage companies and truckload carriers need to watch. The West Coast has seen containerized imports fall to 2019 levels, whereas the East Coast is 17% above that, but based on the latest import data from IHS Markit, the gap may be closing. Excess intermodal and truckload capacity, along with low spot rates in California and the aforementioned draft restrictions in the Panama Canal, will provide shippers with an attractive alternative – the ports of Los Angeles, Long Beach, and others from California to Washington that are ready to handle inland import container moves.
According to IHS Markit, July imports on the West Coast were 14% lower than in 2022, whereas East Coast imports were down just 4% over the same timeframe. Gulf Coast import volumes were down 2% year-over-year (y/y). In July, New York was the busiest port for imports port, unseating Los Angeles, which dropped to number two based on lower volumes. Shipping expert John McCown reports, “July is the tenth straight month where total inbound volume saw a double-digit percent decline y/y. West Coast ports were much weaker with a decline of 21.0% month-over-month (m/m), while East/Gulf Coast ports had a 4.4% m/m volume decrease.”
Market Watch
All rates cited below exclude fuel surcharges unless otherwise noted.
California outbound dry van spot rates, at $1.99/mile, are just $0.08/mile higher than in 2019 after dropping $0.18/mile since the start of July. In the larger Los Angeles spot market, outbound rates fell for the fourth week to $1.79/mile, while in neighboring Ontario, loads paid carriers $1.88/mile. In Stockton, available capacity continues to loosen following last week’s $0.06/mile decrease to $1.71/mile. On the Los Angeles to Stockton lane, popular with imports heading to the NoCal warehouse market, rates were the lowest in 12 months at $2.40/mile, almost $1.00/mile lower than last year.
In the Midwest, – Illinois, Indiana, and Ohio – outbound spot rates averaged $1.95/mile for outbound loads last week, identical to 2019. However, solid gains were reported in the Toledo market, where spot rates increased by $0.06/mile to $1.81/mile for outbound loads.
In Atlanta, a constant top five market for outbound demand, rates dropped another $0.05/mile last week, making it four in a row. At $1.62/mile, Atlanta spot rates are $0.03/mile lower than in 2019.

Load-to-Truck Ratio (LTR)
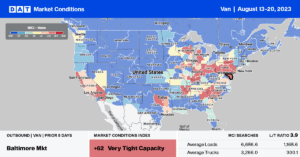
Dry van spot market load posts dropped to the lowest level since 2016 following last week’s 13% week-over-week decrease. Carrier equipment posts dropped, resulting in last week’s dry van load-to-truck ratio increasing from 2.63 to 2.91.
Linehaul Spot Rates
The dry van linehaul national average rate slid slightly further last week, dropping just over a penny per mile to $1.58/mile, – just $0.02/mile above 2019 levels. Compared to DAT’s Top 50 lanes, (which averaged $1.90/mile last week), while the national average remained $0.32/mile lower.


