The shipments component of the Cass Freight Index decreased by 1.7% month-over-month (m/m) in September, following a 1.0% increase in August. In seasonally adjusted (SA) terms, the index fell by 2.6% from August to September. Year-over-year (y/y), shipments declined by 5.2% in September, compared to a 1.9% y/y drop in August.
Get the clearest, most accurate view of the truckload marketplace with data from DAT iQ.
Tune into DAT iQ Live, live on YouTube or LinkedIn, 10am ET every Tuesday.
Tim Denoyer, author of the Cass report and vice president at ACT Research, said, “A key theme we have been highlighting for over a year is the insourcing of freight from the for-hire market to private fleets. This trend is a defining characteristic of the current soft freight cycle, even as the economy performs better than expected. Owner-operators’ resilience plays a significant role in this situation, although the number of operating authority revocations continues to rise.
Denoyer notes that a lower equipment supply, especially from private fleets, may significantly impact the market turnaround in 2025. Next month, a new FMCSA regulation could potentially downgrade the commercial driver’s licenses (CDLs) of tens of thousands of holders in states that have not previously enforced the FMCSA’s Drug & Alcohol Clearinghouse.
Market watch
All rates cited below exclude fuel surcharges, and load volume refers to loads moved unless otherwise noted.
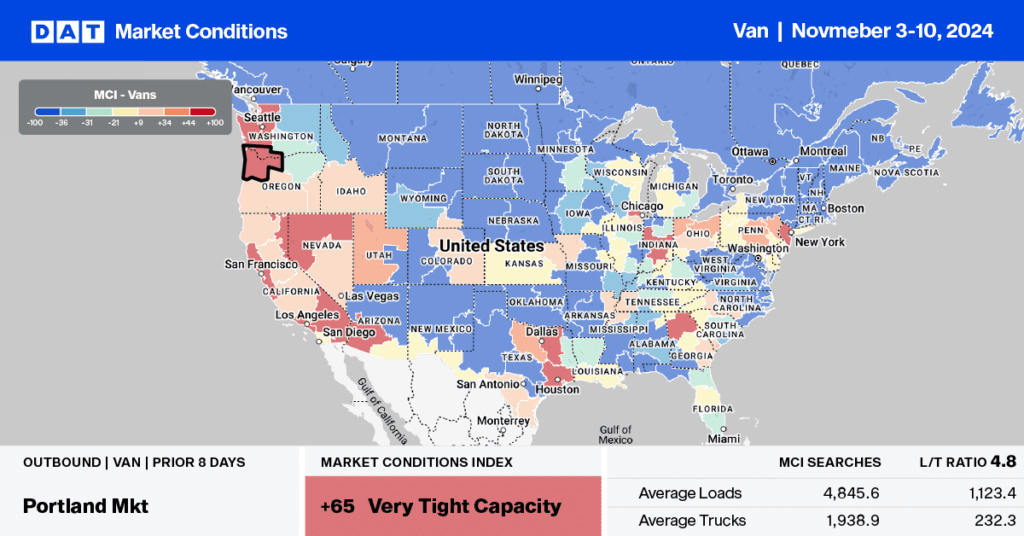
This week, we focus on Canadian ports where recent labor contract disagreements have resulted in freight disruptions. On the east coast, the two Termont terminals at the port of Montreal, which account for 40% of container traffic, have been blocked since Halloween, when CUPE (Canadian Union of Public Employees) Local 375 called an unlimited strike. On the west coast, the ports of Vancouver and Prince Rupert were affected by the BCMEA’s (B.C. Maritime Employers Association) decision to lock out ILWU (International Longshore and Warehouse Union) Local 514 workers early last week.
From a truckload perspective, the most significant impact is expected in the Pacific Northwest (PNW), where Canadian importers are expected to divert discretionary import volumes to the ports of Seattle and Tacoma in Washington State. Both ports account for around 5% of TEU (twenty-foot equivalent) containerized imports, while the British Columbia ports account for approximately the same volume.
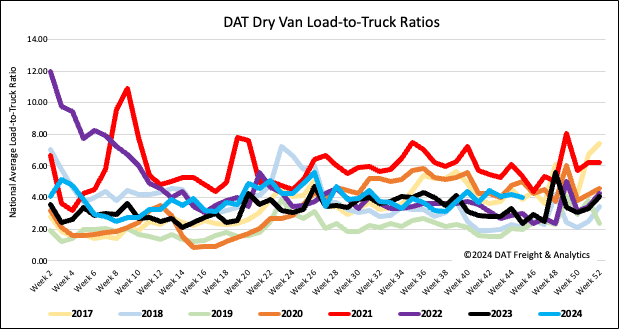
Load-to-Truck Ratio
Last week, the volume of dry van load posts declined by 10%, much the same as last year in the first shipping week of November. Nevertheless, compared to the same period last year, the volume remains 14% higher year-over-year (y/y). Excluding the pandemic-affected years of 2021 and 2022, load posts for Week 45 are 5% higher than in previous years, indicating ongoing strength in the spot market.
Additionally, carrier capacity in the spot market has decreased, resulting in a 6% increase in the dry van load-to-truck ratio (LTR), which decreased 5% to 4.03 last week.
Linehaul spot rates
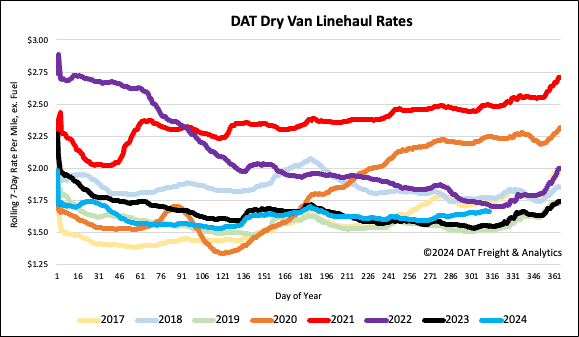
Even though the volume of loads moved decreased by just over 3%, the available capacity of dry vans tightened following last week’s penny-per-mile increase. At $1.67/mile, linehaul rates are holding around $0.11/mile higher than last year and have gained $0.04/mile since the ILA strike and hurricanes Milton and Helene made landfall. Until then, spot rates had been tracking almost identically with last year.
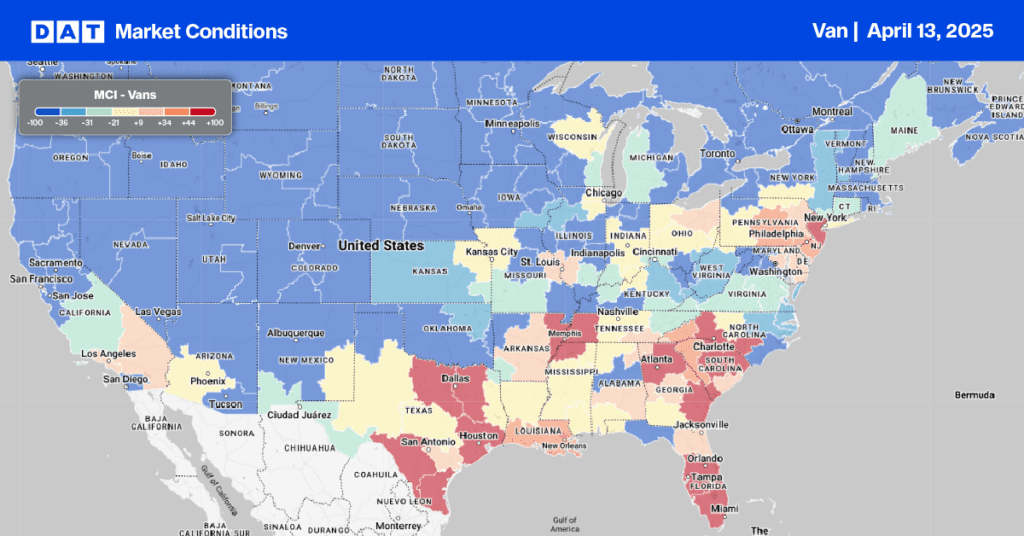
As the port worker lockout in Vancouver and Prince Rupert ports drags on, we see higher truckload volumes out of the Seattle, WA, freight market. Market rates were up $0.05/mile to $1.39/mile last week, just over $0.10/mile higher than last year. On the high-volume Seattle to Stockton lane, volumes rose 1.4% and 55% m/m, pushing up spot rates by $0.04/mile to $0.97/mile. That’s still $0.07/mile lower than last year, though.
