A soft truckload freight market is driven by factors including U.S. shippers’ increasing use of privately operated fleets and favorably-priced intermodal rail capacity. According to Ari Ashe, Senior Editor at the Journal of Commerce (JOC) and author of the latest JOC Intermodal Savings Index (ISI), “Intermodal shippers in the U.S. saved almost 26% under annual contracts in the third quarter, down from savings of more than 29% in Q3 2022. Still, the intermodal savings for shippers choosing rail over trucking are approximately in line with long-term averages and will likely be the norm through the end of the year. In the spot market, an average shipper saved about 16.7% using intermodal in the third quarter.”
The ISI is an excellent barometer for measuring shippers’ likelihood to use rail (intermodal) over road to move freight. The JOC indices measure how much money a shipper should save on 117 modally competitive U.S. lanes, with a savings of 10% being the minimum benchmark for many intermodal shippers before switching to road transport. Less than 10% saving translates into savings of less than $200 on many lanes and less than $150 per container on shorter haul lanes. Such a discount can be easily wiped out if the intermodal shipper incurs detention (excessive per diem) or demurrage (storage) fees or faces compliance fines for late deliveries.
Get the clearest, most accurate view of the truckload marketplace with data from DAT iQ.
Tune into DAT iQ Live, live on YouTube or LinkedIn, 10am ET every Tuesday.
Market watch
All rates cited below exclude fuel surcharges unless otherwise noted.
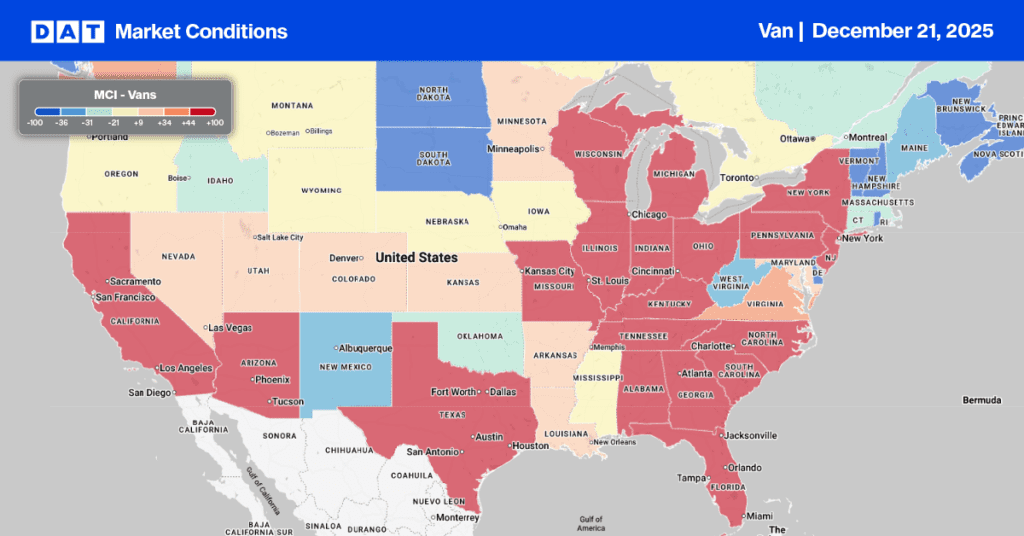
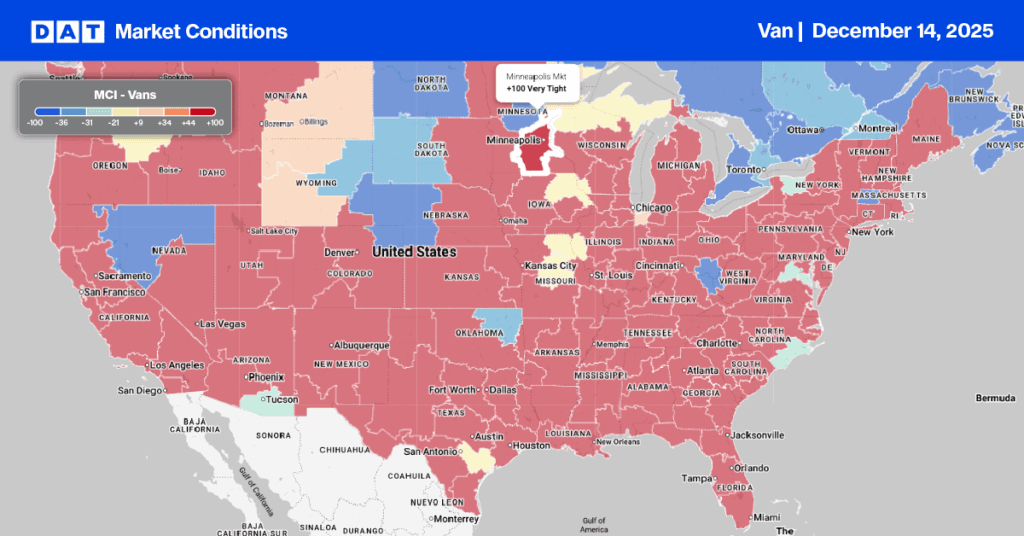
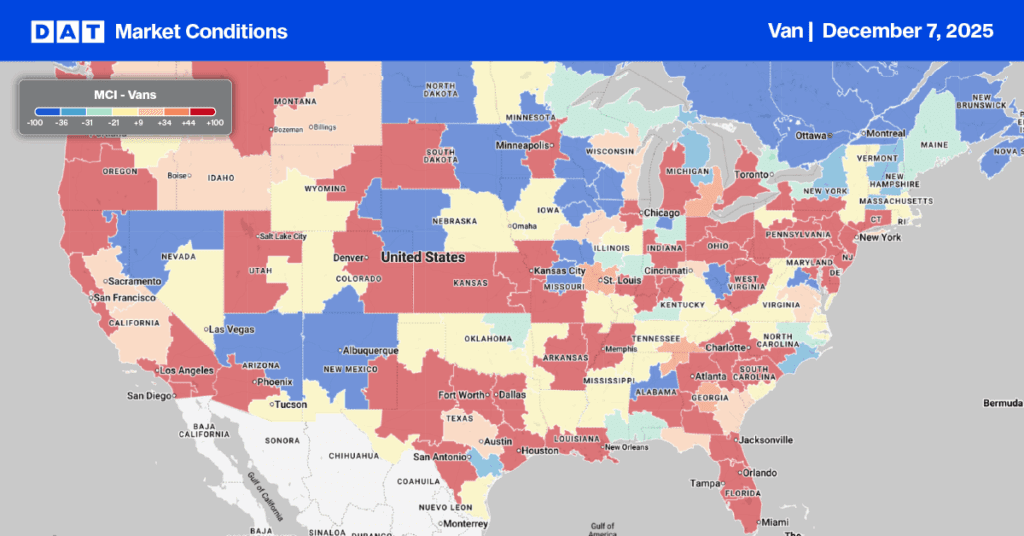
Dry van linehaul rates continue to track closely with the soft 2019 freight market in our Top 5 spot market states (California, Georgia, Illinois, New Jersey, and Texas), where spot rates were around $0.06/mile higher at $1.75/mile last week. In Atlanta’s large Southeast freight distribution market, spot rates increased by $0.03/mile to an average outbound rate of $1.39/mile.
On the high-volume dry van lanes from Atlanta to the Lakeland and Miami markets, carriers were paid an average of $2.62/mile and $2.07/mile, respectively. At $2.09/mile in Illinois, outbound spot rates are identical to 2019 following last week’s $0.03/mile increase, while on the 700-mile haul to Atlanta, carriers averaged $2.11/mile, the highest since February, but $0.18/mile lower than this time last year.
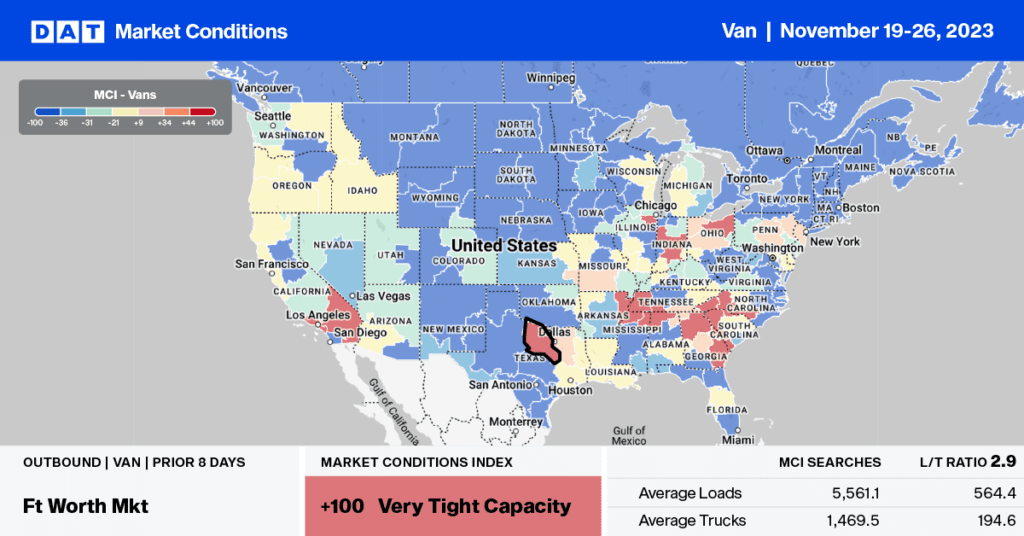
Load-to-Truck Ratio (LTR)
The dry van spot market load post (LP) volume dropped as it typically does during Thanksgiving week, following last week’s 45% decrease as the markets continued along a soft trajectory during what’s typically the peak shipping season. Carrier equipment posts decreased by 32% week-over-week (w/w) as most drivers took time off to be with family, resulting in last week’s dry van load-to-truck ratio (LTR) decreasing to 1.60.
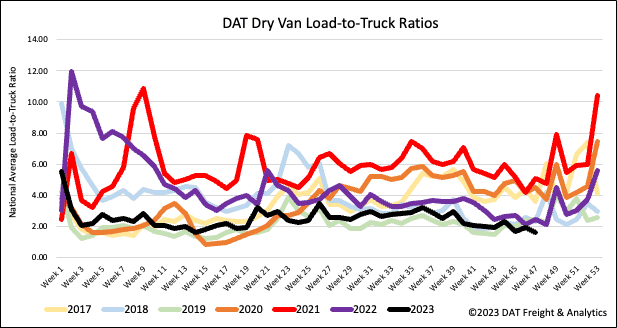
Linehaul spot rates
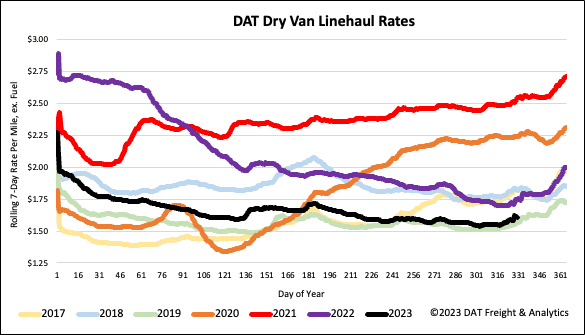
After remaining flat for over two months, dry van linehaul rates rose last week, increasing by just $0.06/mile. At $1.63/mile, dry van spot rates are $0.14/mile lower than last year and only $0.04/mile higher than in 2019. Compared to DAT’s Top 50 lanes based on the volume of loads moved, which averaged $1.89/mile last week, the national average is around $0.26/mile lower.
