The ports of Savannah and Charleston were the only Top 10 ports in the U.S. to record a sequential increase in monthly imported container volume last month. Driven by a surge in furniture imports, total TEU (twenty-foot equivalent units) volume was up 9% and 9.2% respectively while national containerized imports decreased by 11% last month. National furniture import volumes decreased by almost the same amount. In contrast, furniture imports in Savannah and Charleston increased by 18% and 36% respectively in February as importers pulled forward orders to avoid the implementation of additional tariffs mainly on Chinese imports.
Get the clearest, most accurate view of the truckload marketplace with data from DAT iQ.
Tune into DAT iQ Live, live on YouTube or LinkedIn, 10am ET every Tuesday.
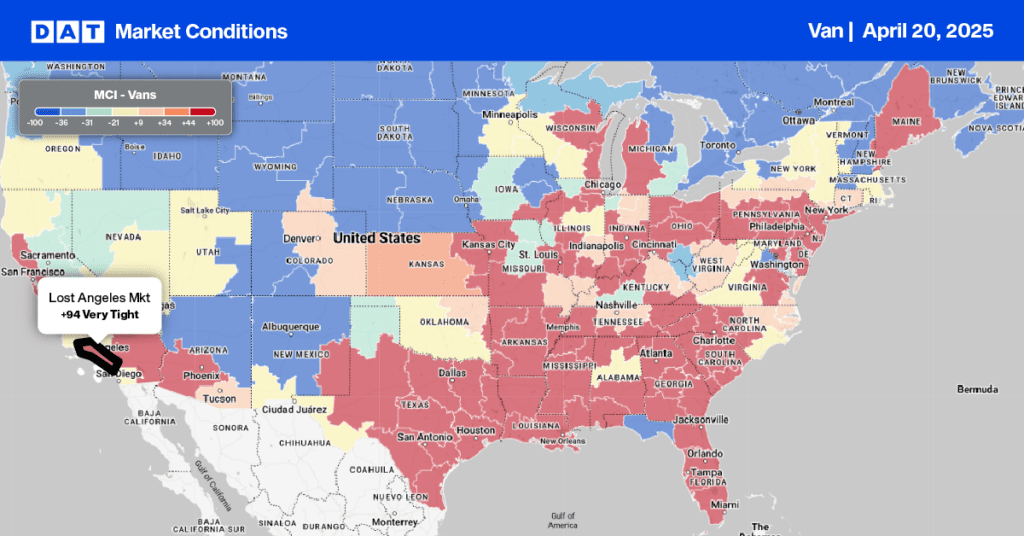
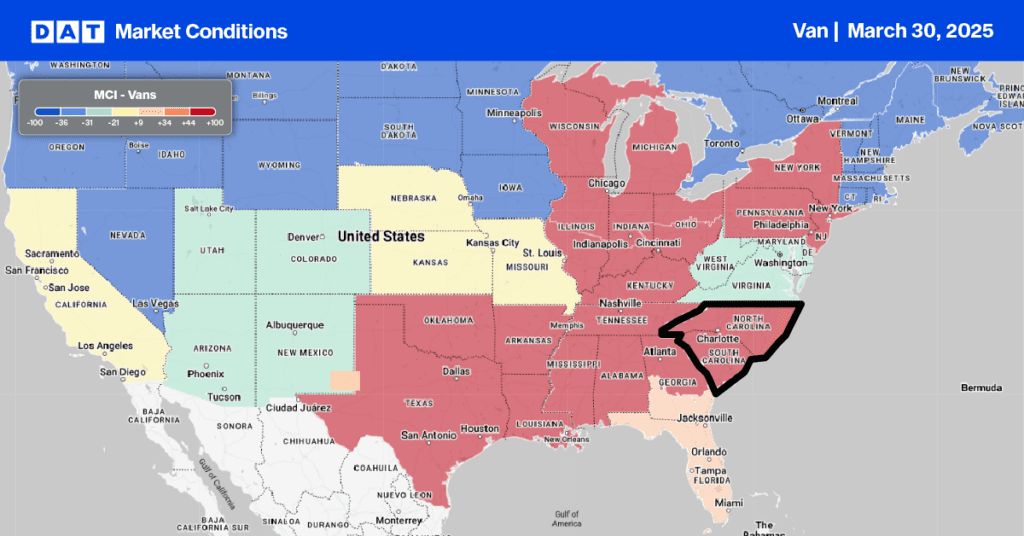
Asia accounted for 90% of imported containerized furniture in February in Savannah and Charleston, the highest volume ever recorded for the month of February dating back to 2010. The region’s dominance in the furniture market also makes it a large dry van freight market, where inbound regional volumes are just over 10% higher than last year. In contrast, outbound volumes are up 24% y/y. In High Point, NC, the Furniture Capital of the World, outbound volumes are 45% higher than this time last year
The region’s furniture-making heritage owes much to its abundant timber resources and close proximity to major ports and interstate highways, with 36% or 121 million people located within a day’s drive by truck.
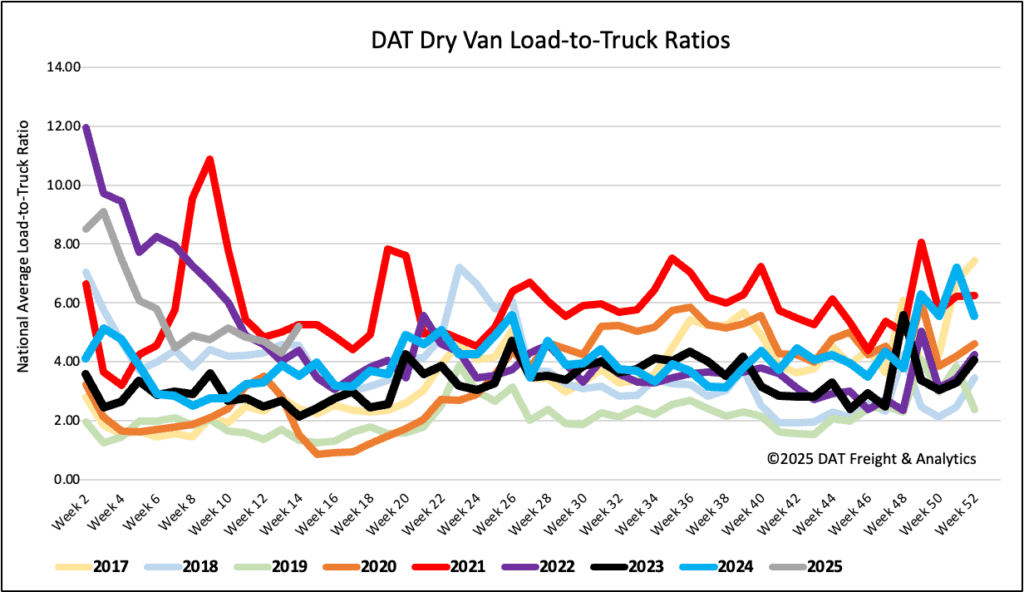
Load-to-Truck Ratio
Load post volumes increased by 11% last week, following the typical month-end volume surge. Volumes are just over 4% higher than last year and 20% higher than the long-term Week 13 average. Last week’s dry van load-to-truck ratio (LTR) was up 21% to 5.21.
Linehaul spot rates
Dry van linehaul rates were flat last week, with the national 7-day rolling average paying carriers an average of $1.63/mile on a 3% lower load volume. At $1.63/mile, linehaul rates are $0.05/mile higher than last year and $0.07/mile higher than 2019. On DAT’s Top 50 lanes, ranked by the volume of loads moved, carriers were paid an average of $1.91/mile, flat again last week and $0.28/mile higher than the national 7-day rolling average spot rate.
In our Midwest Region bellwether states, which have the highest correlation to the national average,, outbound spot rates increased by $0.02/mile on a 2% lower volume of loads moved. Carriers were paid an average of $1.87/mile, $0.24/mile higher than the national 7-day rolling average.