February 2025 import volumes as measured by TEU Volume (twenty-foot equivalent units), were down 10% month-over-month (m/m) but up 9% year-over-year (y/y), and the highest ever recorded for February. The second month on the ocean shipping calendar is typically the lowest due to Chinese New Year or Lunar New Year celebrations and the resulting factory shutdowns in Asia. Driven by the massive pull-forward of imports to avoid tariffs and strike action by the International Longshoremen Association (ILA) at East and Gulf Coast ports last October, warehousing is again brimming with inventory.
Get the clearest, most accurate view of the truckload marketplace with data from DAT iQ.
Tune into DAT iQ Live, live on YouTube or LinkedIn, 10am ET every Tuesday.
West Coast port volume, which handled 46% of national volume in February, reported a decrease of 21% m/m, with significant declines at the Ports of Los Angeles and Long Beach, down 19% and 33% m/m respectively. East Coast port volumes (44%) fell 3% m/m, with the Port of New York and New Jersey experiencing a 9% decline, while Savannah saw an 8% increase m/m. Gulf Coast Port (9%) volumes were down 12% m/m, with Houston down 17% m/m.
Imports from China to the U.S., which accounted for 42% of the national total TEU volume, were down 12% m/m but up 12% y/y. February 2025 volumes were 26% higher than the monthly average back to 2015 and 37% higher than the pre-pandemic average (2015-2020), translating to an additional 187,000 53-foot truckloads last month compared to the long-term February truckload equivalent volume.
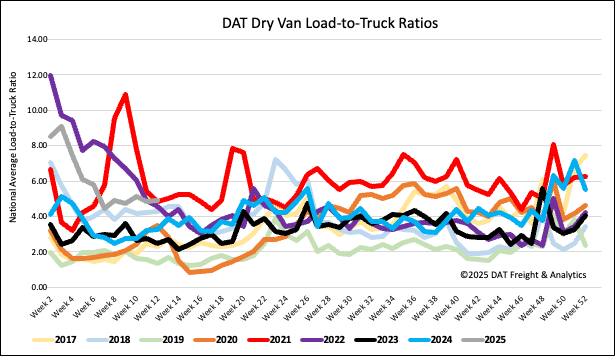
Load-to-Truck Ratio
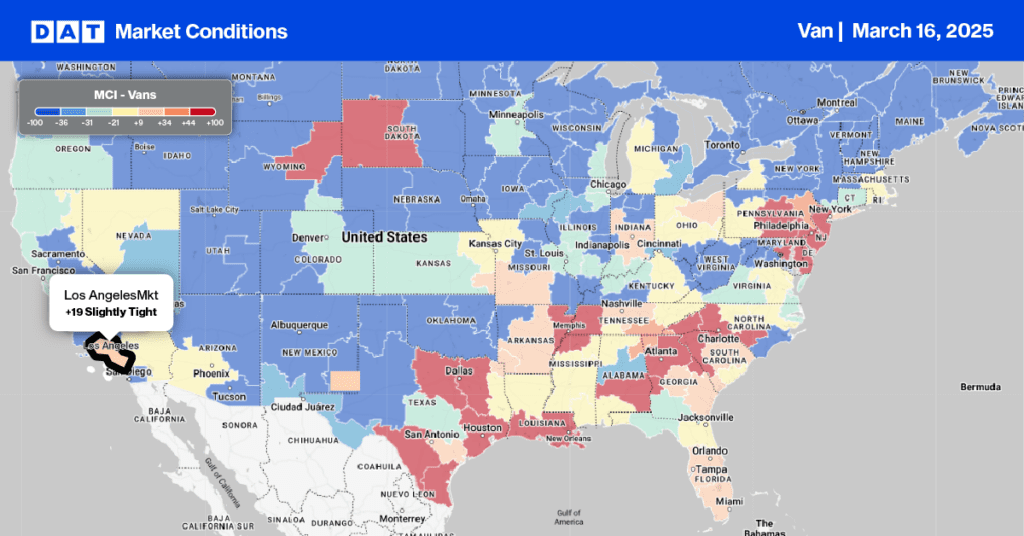
Load post volumes decreased for the third week, following last week’s 2% decline. Compared to Week 11 last year, volumes are 6% higher. Last week’s dry van load-to-truck ratio (LTR) was down slightly to 4.89.
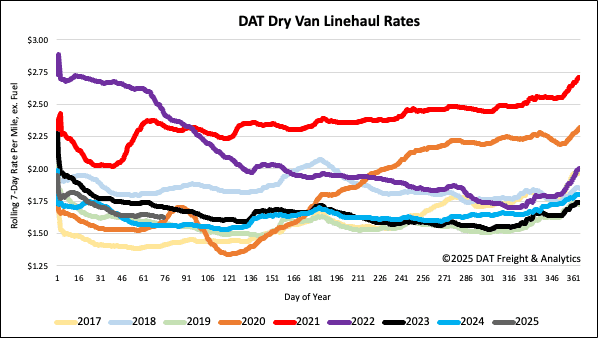
Linehaul spot rates
Dry van linehaul rates decreased by $0.02/mile last week, with the national 7-day rolling average paying carriers an average of $1.64/mile on a 1% higher load volume. At $1.64/mile, linehaul rates are $0.06/mile higher than last year and $0.04/mile higher than 2019. On DAT’s Top 50 lanes, ranked by the volume of loads moved, carriers were paid an average of $1.91/mile, down a penny per mile and $0.27/mile higher than the national 7-day rolling average spot rate.
In our Midwest Region bellwether states, which have the highest correlation to the national average, volumes dropped 1% w/w. At the same time, outbound spot rates decreased by $0.04/mile, paying carriers an average of $1.89/mile, $0.25/mile higher than the national 7-day rolling average. Inbound regional rates averaged $0.10/mile lower at $1.70/mile, down $0.03/mile w/w on 1% higher volumes.
On the northern border, volumes have crashed following the introduction of tariffs on Canadian imports. In Toronto, the largest dry van province in Canada, regional outbound linehaul rates to the U.S. in the 250 to 750-mile range were down 10% w/w paying carriers an average of $2.20/mile. That’s almost $0.20/mile lower than the long-term average regional linehaul rate. More concerning for cross-border carriers is the drop-off in weekly volumes, which have halved from Toronto to the U.S. in the last two weeks.