With sweeping tariffs now imposed on all U.S. trading partners, import cargo at the nation’s major container ports is expected to drop dramatically in May, according to the Global Port Tracker (GPT) report released last week by the National Retail Federation and Hackett Associates. GPT projects April imports to come in 3.1% higher than last April. In contrast, May is expected to end 19 consecutive months of year-over-year (y/y) growth, dropping sharply to 1.66 million TEU, down 20.5% from last year. Looking further into the shipping year, June is forecast to drop by 26.6%, July down 27% year over year, and August down 26.8%.
Get the clearest, most accurate view of the truckload marketplace with data from DAT iQ.
Tune into DAT iQ Live, live on YouTube or LinkedIn, 10am ET every Tuesday.
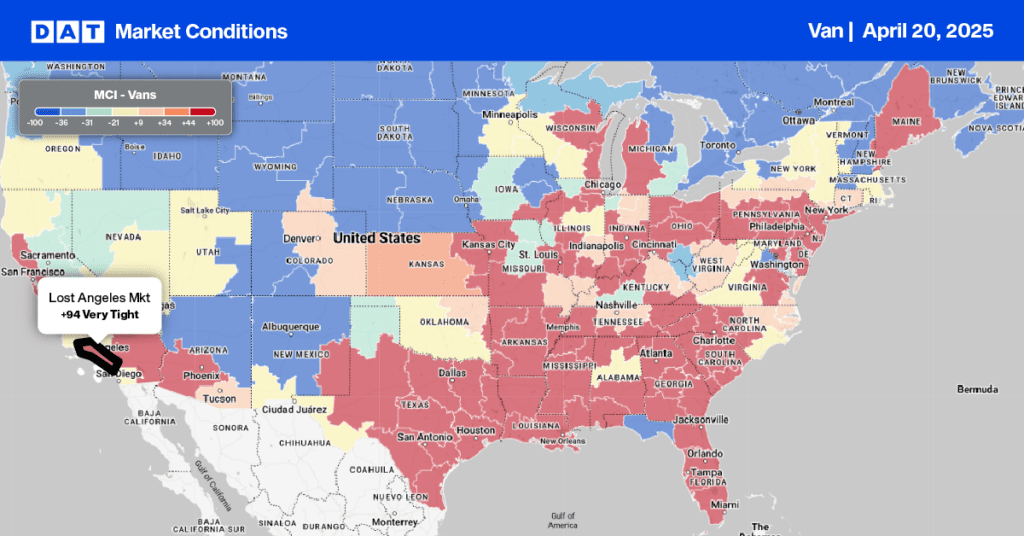
March imports, which included cargo shipped before the new tariffs were announced, came in 7.4% higher than February and 11% higher than last year. Reflecting the trade war with China, national imports from Northeast Asia were down 2.8% month-over-month (m/m) but dropped 17% at the Port of Los Angeles. Imports from China to Los Angeles dropped 21% m/m, driven by a 9% decline in furniture imports, the highest volume commodity imported nationally, accounting for 12.1% of volume year-to-date.
Load-to-Truck Ratio
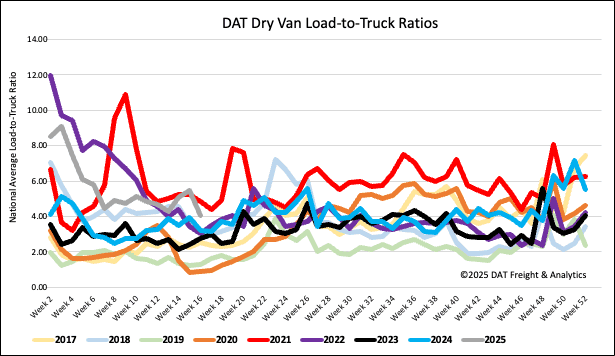
Following last week’s plunge in dry van load post volumes, the market was mostly unchanged last week. Compared to last year, volumes are almost identical and 27% higher than the long-term Week 16 average excluding the pandemic-impacted years 2020 and 2021. Last week’s dry van load-to-truck ratio (LTR) was down 9% to 4.20.
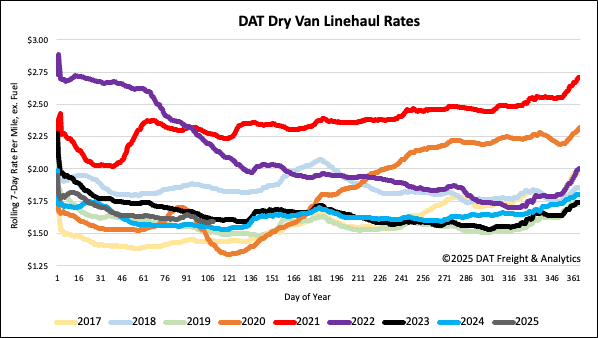
Linehaul spot rates
Dry van linehaul rates dropped by just under $0.02/mile last week, with the national 7-day rolling average paying carriers an average of $1.60/mile on a 4% lower load volume. At $1.66/mile, linehaul rates remained $0.05/mile higher than last year and $0.08/mile higher than in 2019 and 2020. On DAT’s Top 50 lanes, ranked by the volume of loads moved, carriers were paid an average of $1.89/mile, flat last week and $0.29/mile higher than the national 7-day rolling average spot rate.
In our Midwest Region bellwether states (n=13), which account for 43% of loads moved nationally last week and have the highest correlation to the national average, outbound spot rates decreased by $0.04/mile on a 5% lower volume of outbound loads moved. Inbound loads moved were down by 5% w/w also. Carriers were paid an average of $1.79/mile, $0.19/mile higher than the national 7-day rolling average.