A leading indicator of truckload demand, the New Orders component of the Institute of Supply Managers (ISM) Purchasing Managers Index (PMI) dropped 6% in August and 5% compared to a year ago. The ISM said its manufacturing PMI rose to 47.2 last month from 46.8 in July, the lowest reading since November. A PMI reading below 50 indicates a manufacturing sector contraction, accounting for 10.3% of the economy. The decline in new orders and increased inventory (up 2.6 percentage points) suggested factory activity could remain subdued for a while.
Get the clearest, most accurate view of the truckload marketplace with data from DAT iQ.
Tune into DAT iQ Live, live on YouTube or LinkedIn, 10am ET every Tuesday.
Timothy R. Fiore, Chair of the Institute for Supply Management, states, “While still in contraction territory, U.S. manufacturing activity contracted slower than last month. Demand continues to be weak, output declines, and inputs stayed accommodative. Demand remains subdued, as companies are unwilling to invest capital and inventory due to current federal monetary policy and election uncertainty. Production execution was down compared to July, putting additional pressure on profitability. Suppliers have capacity, with lead times improving and shortages less severe.”
Market watch
All rates cited below exclude fuel surcharges, and load volume refers to loads moved unless otherwise noted.
This week, let’s focus on the Chicago freight market. Over the last year, outbound truckload volumes have increased by 11%, which has caused carrier spot rates to rise by around 3% in recent weeks. Chicago is consistently one of the top 5 freight markets and is dominated by regional freight to nearby Minneapolis, Columbus, and Detroit, which collectively make up around 13% of the weekly load volume. Longer-haul loads to Atlanta, Dallas, and Kansas City represent about 9% of the volume.
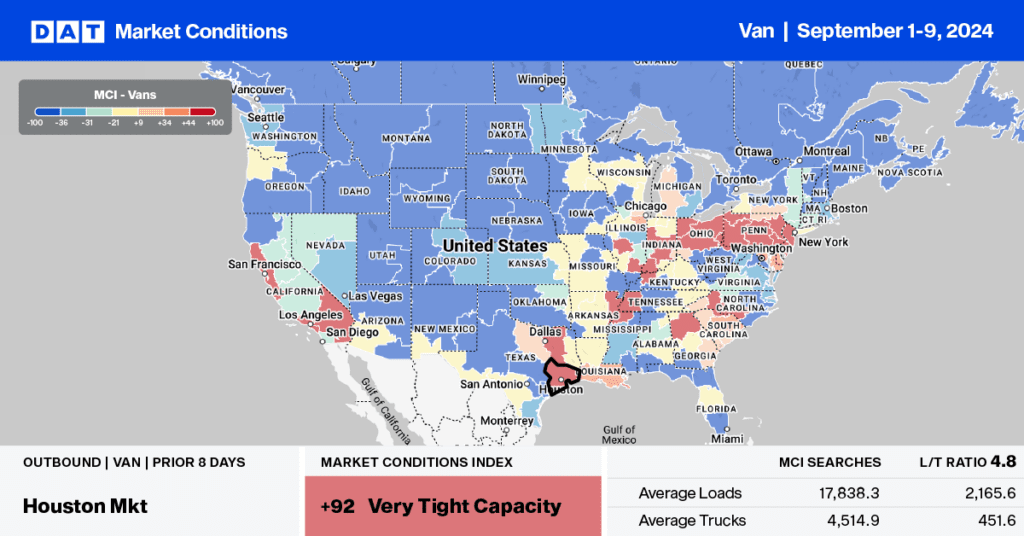
In recent weeks, load post volumes have been increasing. According to DAT’s Market Condition Index (MCI), truckload capacity for outbound loads is expected to tighten this week. For regional loads to Minneapolis, the number one spot market lane, carriers were paid an average of $2.08/mile last week, up $0.03/mile compared to the previous month, with a 26% lower volume. The second most popular lane to Columbus, OH, saw spot rates average $2.49/mile, up 4% on a 27% lower volume.
Load-to-Truck Ratio
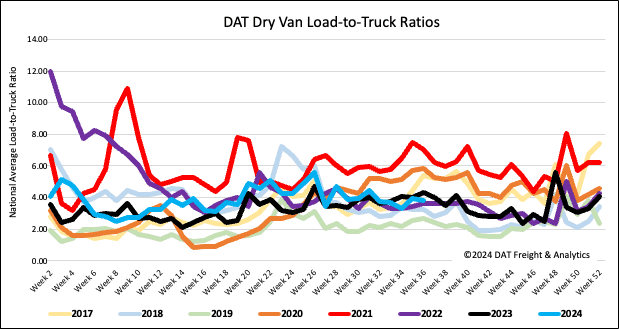
Load post volumes were predictably down on a short week following Labor Day but in line with prior years. Carrier equipment posts were also down as carriers took time off, resulting in a 2% decrease in the dry van load-to-truck ratio (LTR) to 3.84, 2% below the long-term LTR average for this time of the year.
Linehaul spot rates
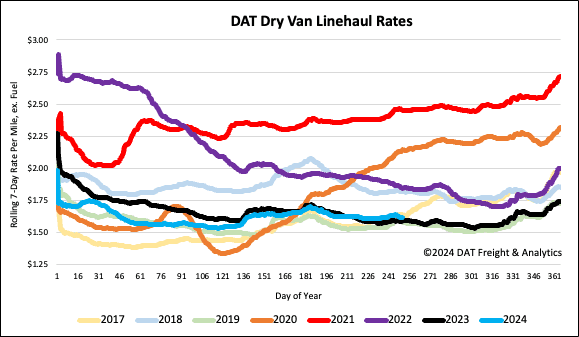
Last week, dry van linehaul rates dropped by one cent per mile to a national average of $1.62/mile, with a 25% decrease in the volume of loads moved during the short workweek. At $1.62/mile, linehaul rates are $0.02/mile higher than last year and $0.03/mile lower than the 3-month trailing average. According to DAT’s Top 50 lanes, spot rates increased by one cent per mile to $1.99/mile based on the volume of loads moved. This is $0.37/mile higher than the national average.