The Commercial Vehicle Safety Alliance (CVSA) has announced Aug. 25-31 dates for this year’s Brake Safety Week. Brake Safety Week is a commercial motor vehicle and driver inspection, regulatory compliance enforcement initiative, a brake-safety awareness and outreach opportunity, and a brake-related inspection and violation data collection project.
For this year’s Brake Safety Week, inspectors will focus on the condition of brake linings and pads. Brake lining and pad issues may result in vehicle violations and affect a motor carrier’s safety rating. In addition, some jurisdictions have performance-based brake testers (PBBTs) and will use them during Brake Safety Week. A PBBT is a machine that assesses a vehicle’s braking performance.
Get the clearest, most accurate view of the truckload marketplace with data from DAT iQ.
Tune into DAT iQ Live, live on YouTube or LinkedIn, 10am ET every Tuesday.
In addition to educational outreach by law enforcement agencies, transportation safety organizations, and individual officers, CVSA aims to help prepare drivers, motor carriers, owner-operators, and mechanics for this year’s Brake Safety Week.
- View the inspector’s inspection procedure.
- You can download a checklist that outlines the tools needed to inspect S-cam brakes, what to look for, and how to measure pushrod stroke.
- Learn about the components of the vehicle that the inspector will check.
- Download a flyer with 10 brake linings and pad tips.
Market watch
All rates cited below exclude fuel surcharges, and load volume refers to loads moved unless otherwise noted.
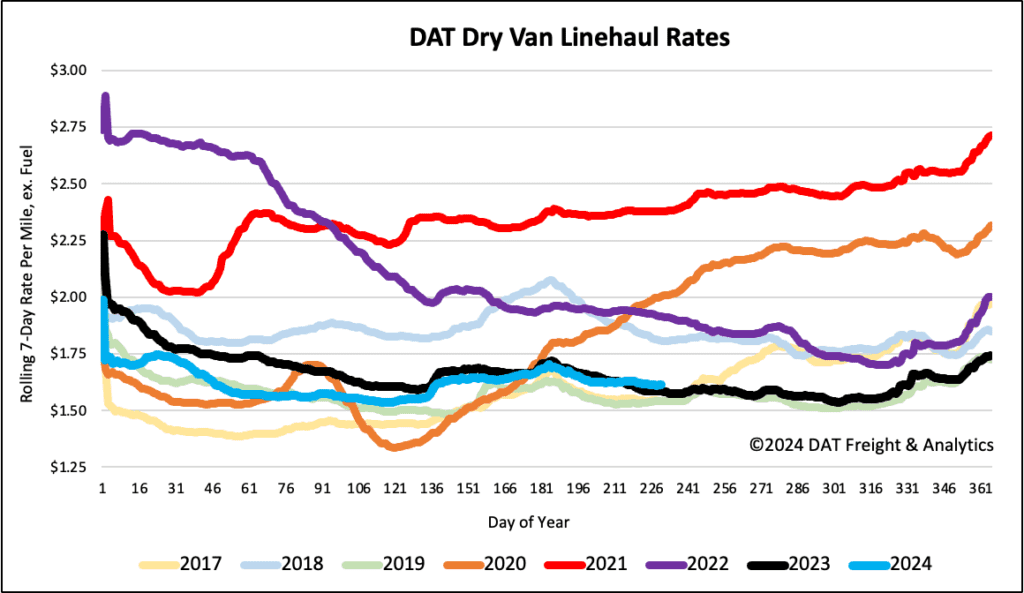
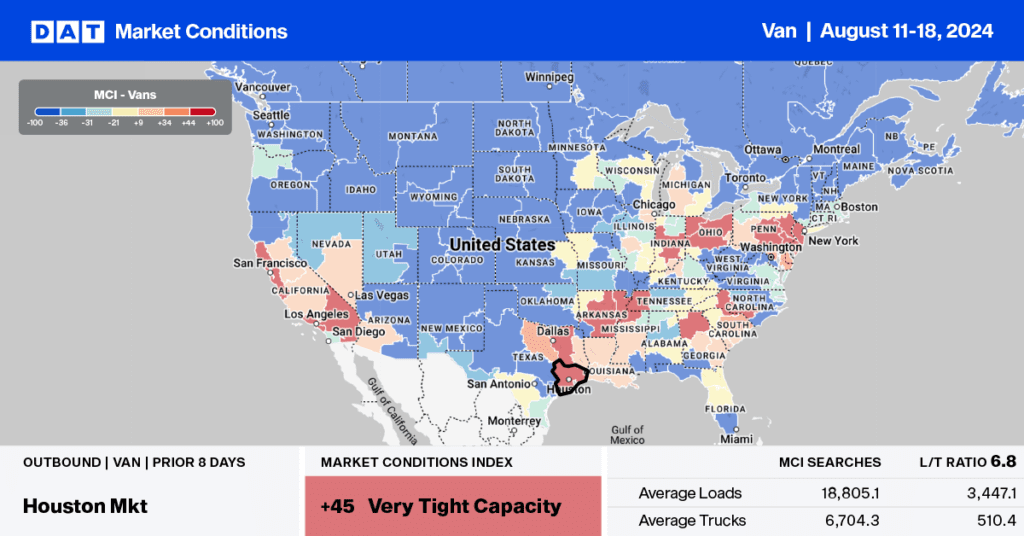
This week, we are focusing on the combined Los Angeles/Ontario freight markets in California, home to the “Inland Empire,” a vast freight distribution market. The Inland Empire is one of the largest warehouse markets in the country, serving as a sorting, storage, and shipping hub for the hundreds of thousands of imported containers that arrive in the Ports of Long Beach and Los Angeles. The dry van linehaul rates are currently $2.23/mile, about $0.10/mile higher than last year. State-average outbound linehaul rates are also higher, at $2.13/mile, which is almost $0.14/mile higher than last year.
Most outbound load volume from the Los Angeles/Ontario freight markets moves on two lanes—Stockton, CA and Phoenix, AZ, both large warehouse distribution markets. Linehaul rates for Ontario-Phoenix loads are currently $3.10/mile, approximately $0.09/mile higher than last year. On the regional lane to Stockton, carrier linehaul rates average $2.48/mile, slightly lower than last year.
Load-to-Truck Ratio
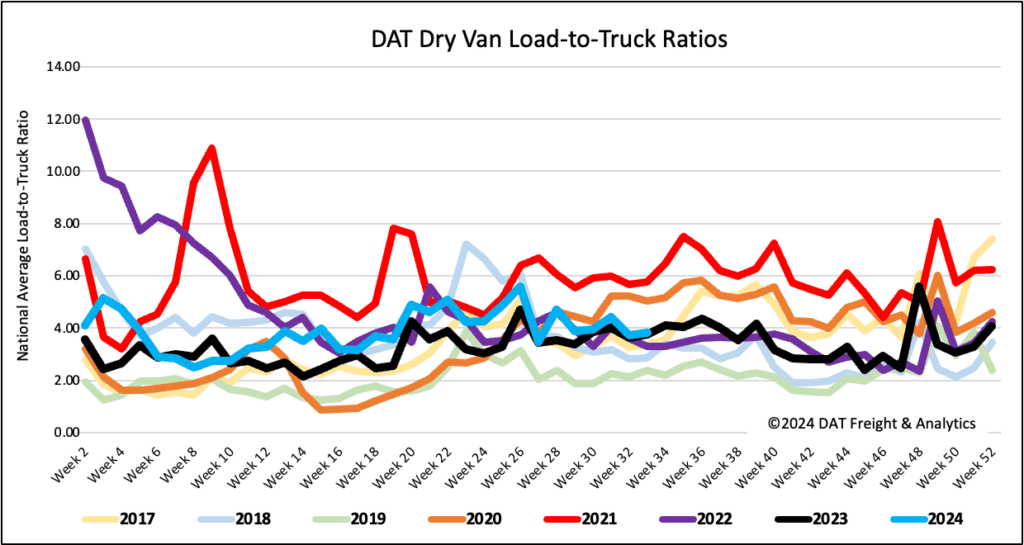
Following last week’s 3% decrease, load post volumes were 2% lower than the levels in Week 33 over the last seven years, excluding the years affected by the pandemic in 2020 and 2021. Capacity loosened slightly on lower volume, leading to a slight increase in the dry van load-to-truck ratio (LTR) to 3.84, 18% above the long-term LTR average for this time of the year.
Linehaul spot rates
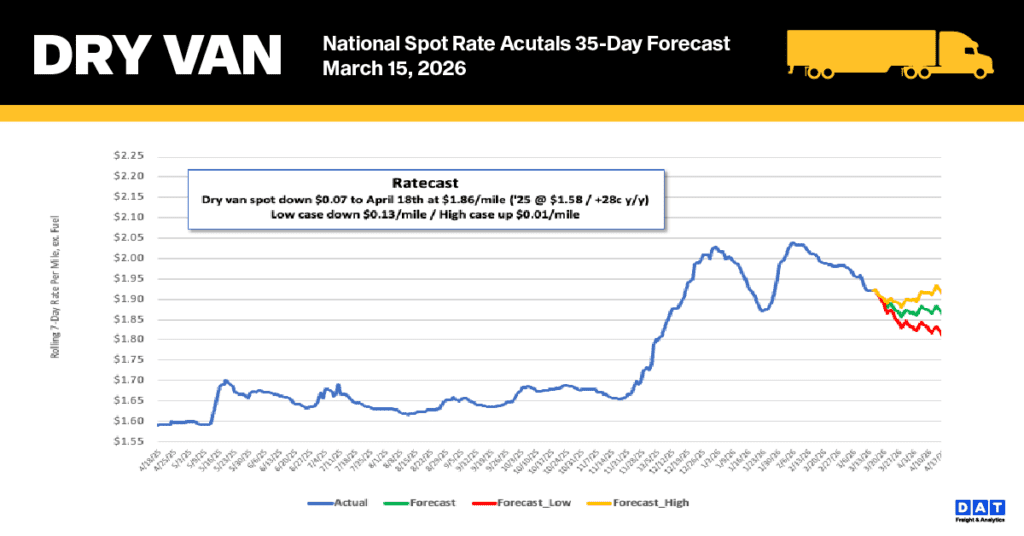
After remaining mostly flat in recent weeks, dry van linehaul rates decreased by half a penny per mile last week to just over $1.62/mile, around $0.03/mile per mile higher than last year. According to DAT’s Top 50 lanes, spot rates have dropped by $0.01 to $1.99 per mile based on the volume of loads moved. This is still $0.37 per mile, higher than the national average.