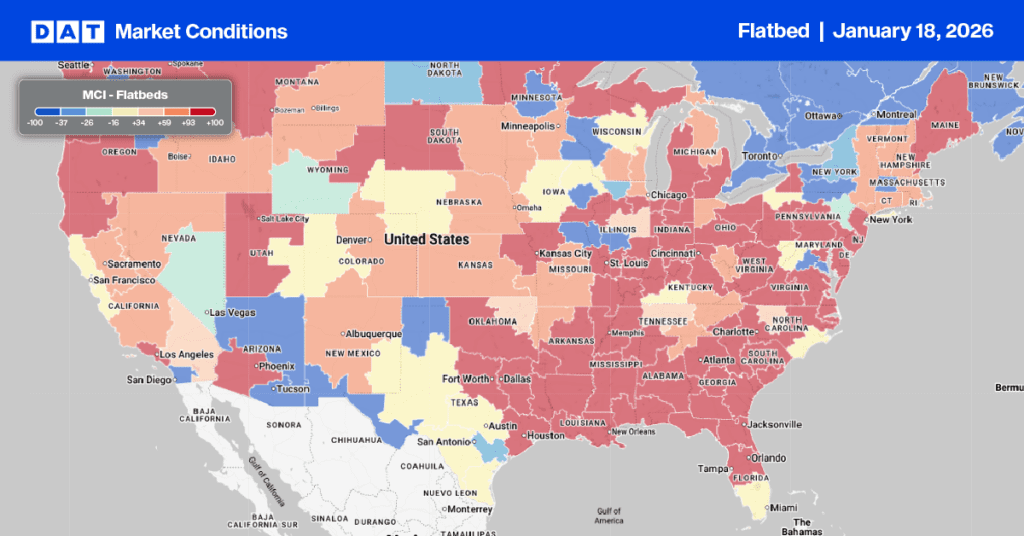
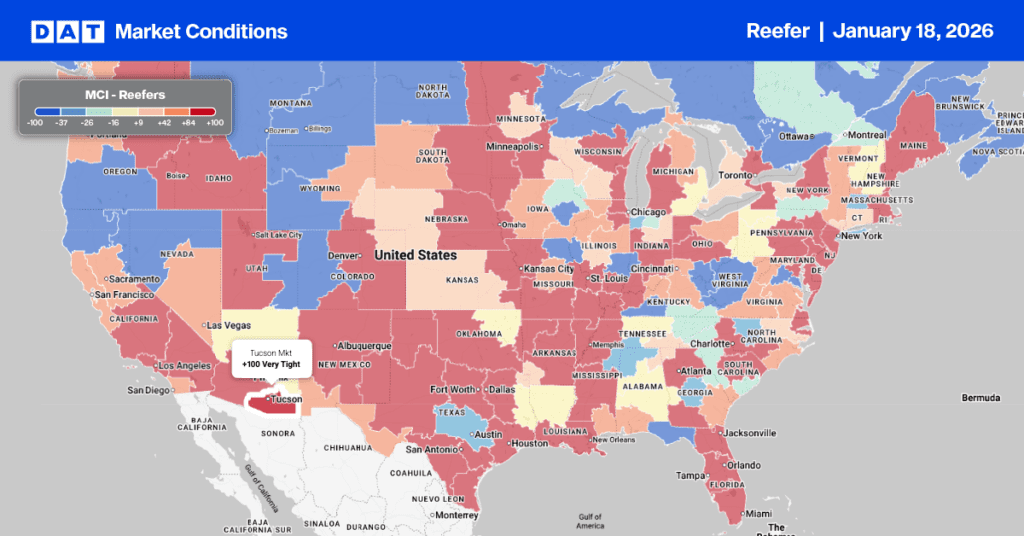
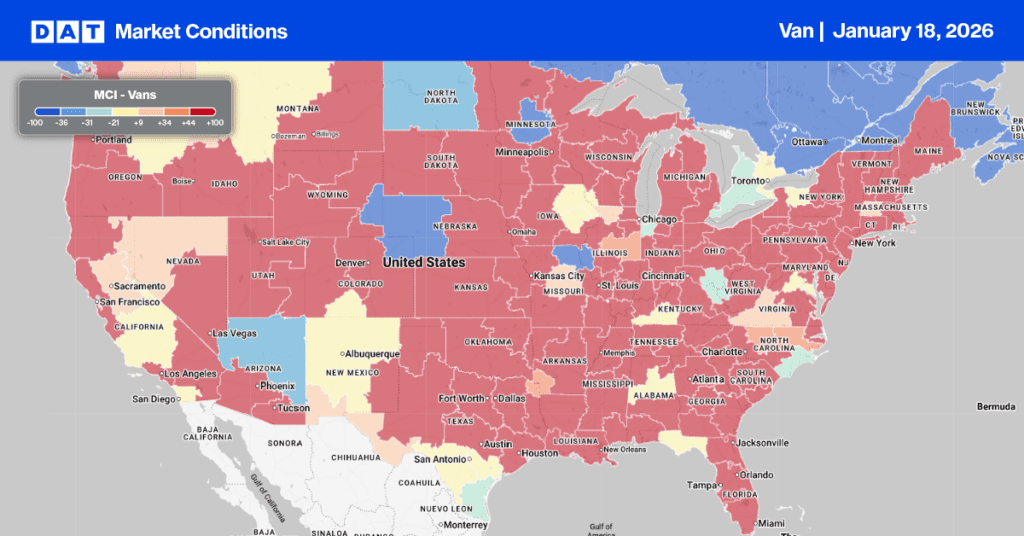
The Energy Information Administration’s (EIA) short-term outlook for diesel prices around $4 per gallon is holding for the moment and providing truckload carriers with some breathing room. Despite the harsh operating conditions, small carriers are showing remarkable resilience.
As spot rates continue to bounce along what appears to be the bottom of the current freight cycle, lower fuel costs are about all that’s helping them. Even though dry van spot rates hover at $0.05/mile above 2019, a notoriously poor year for truckers, operating costs are around $0.16/mile or 10% higher in 2024. The margin squeeze is felt by owner-operators and small fleets, forcing many to the sidelines until the market improves or entirely out of the market.
According to FMCSA data, long-haul carrier exit rates were flat in April at around 7,900 authority revocations. Still, with 11% fewer carriers joining or re-joining the market, net capacity decreased by just over 1,100 carriers last month. Carriers revoking their authorities and opting for leased-on owner-operator rates with larger truckload carriers at around $1.75/mile are better off by around $21,000/year. The flip side of this equation is that an independent contract would be spending an extra $55,000/year (insurance, trailer, permits, tolls, lumpers, authority, etc) to generate an extra $27,000 in revenue from the spot market with dry van rates at $2.01/mile.
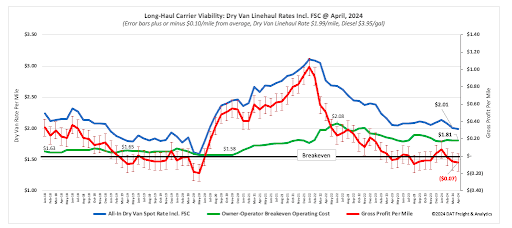
Average operating costs for a long-haul interstate carrier were $1.81/mile at the end of April compared to $1.84/mile a year ago. Operational costs are based on dry van rates, including the fuel surcharge at $2.01/mile, diesel at a national average of $3.95/gal, and driver wages at $60,000/year. 2019 was a challenging year for the trucking industry, especially small carriers, and based on current market dynamics, spot market carriers are starting to operate well into the red as they did in 2019. It was also a year characterized by a non-existent peak season, softening spot rates, and an oversupplied market, i.e., much the same as how the 2024 freight market is shaping up.
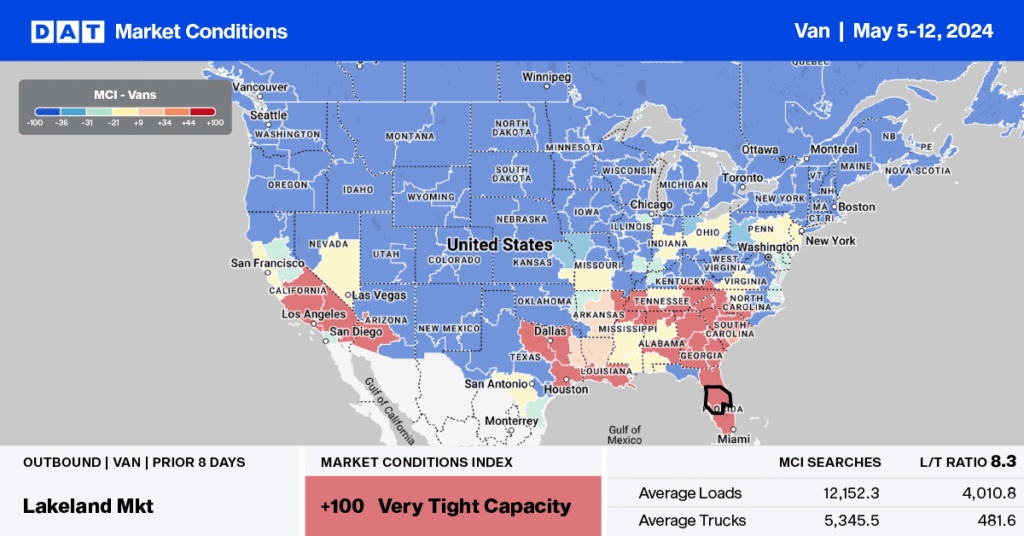
All rates cited below exclude fuel surcharges unless otherwise noted.
Even though dry van rates in the combined Chicago/Joliet market were up slightly last week, averaging $1.84/mile, the last time outbound rates were at this level was in May 2020. Last week’s average is a penny-per-mile lower than last year on a 2% higher volume of loads moved. Regional loads to Minneapolis paid carriers an average $1.89/mile, up $0.05/mile w/w, while loads east to Detroit averaged $2.47/mile, up $0.05/mile.
In Atlanta’s dominant Southeast warehouse distribution market, linehaul rates increased by $0.05/mile to $1.74/mile on a 3% lower volume of loads moved. On the number one lane south to Lakeland, rates were $0.05/mile lower, averaging $2.38/mile, while loads further south to Miami paid carriers an average of $2.26/mile. In Los Angeles, capacity continues to tighten with outbound rates up for the fourth week, averaging $1.72/mile, up $0.03/mile w/w.
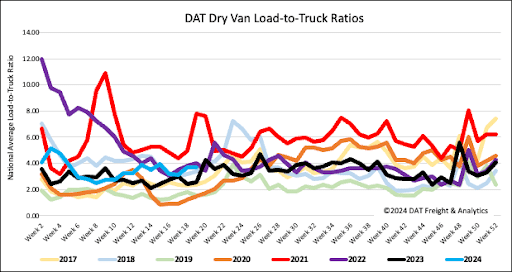
Dry van load posts cooled following last week’s 1% decrease. Although volumes are flat month-over-month (m/m), load posts are tracking around 4% higher than last year. Carrier equipment posts were flat w/w, resulting in the dry van load-to-truck ratio down slightly to 3.67.
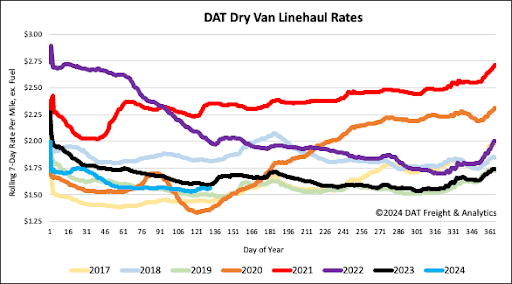
The national average dry van linehaul rate remained flat last week, around $1.57/mile. Compared to last year, linehaul rates are $0.03/mile lower on almost the same volume of loads moved. On the top 50 lanes, based on the volume of loads moved, averaged $1.87/mile last week, $0.30/mile higher than the national average.
