The housing market is experiencing a significant decline in housing starts and a drop in homebuilder sentiment, reaching its lowest level since December 2023. The National Association of Home Builders (NAHB)/Wells Fargo Housing Market Index (HMI) fell two points to 43 in June. This decline is attributed to persistently high mortgage rates, causing buyers to remain on the sidelines.
Get the clearest, most accurate view of the truckload marketplace with data from DAT iQ.
Tune into DAT iQ Live, live on YouTube or LinkedIn, 10am ET every Tuesday.
In addition to high mortgage rates, homebuilders face challenges such as increased rates for construction and development loans, labor shortages, and a scarcity of buildable lots. NAHB Chairman Carl Harris emphasized that these factors collectively contribute to the housing market’s current state.
The U.S. Census Bureau highlights the significant trend of declining multi-family housing starts, dropping 5.5% month-over-month (m/m) and 19.3% below last May. Permits for new homes in this category also fell 9.5% below May 2023. In the new single-family home construction category, there was a decrease of 5.2% m/m and 3.0% y/y. Although permits for single-family homes decreased by 2.9% m/m, they were 5.2% higher than last year.
Truckers would have hauled 22,500 fewer loads than last May but 44,400 more than in May during the 2018 flatbed bull market.
Market watch
All rates cited below exclude fuel surcharges, and load volume refers to loads moved unless otherwise noted.
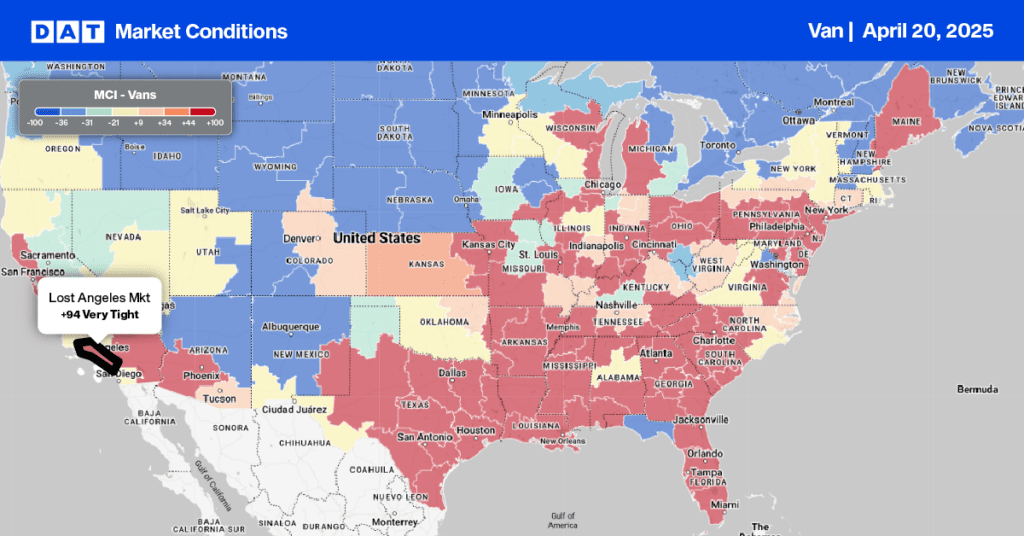
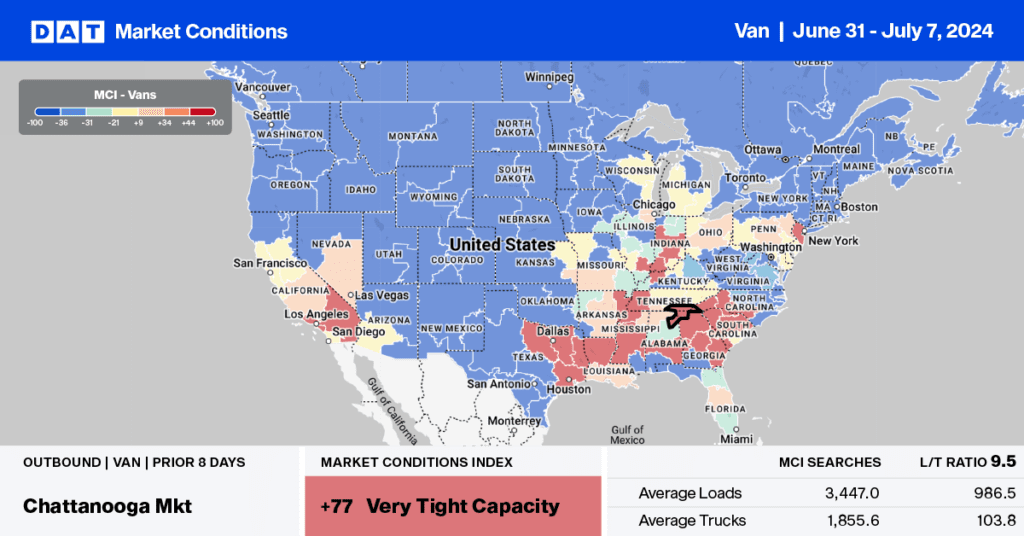
Import volumes at the Los Angeles and Long Beach Ports are expected to increase in June as trade routes shift and shippers pull forward holiday season inventory ahead of possible East Coast labor action by the International Longshoreman Association (ILA). According to the Port of Los Angeles Port Optimizer Report, TEU (twenty-foot equivalent units) are expected to increase 45% year-over-year (y/y) in the second week of July before dropping off in the third week. TEU volume surges habitually flood the dry van spot market in Los Angeles and Ontario, where truckload volume is up 25% in the last month.
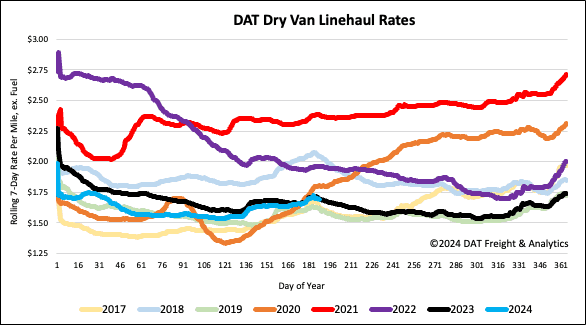
On major freight lanes, beneficiaries of higher import volume, including Stockton and Phoenix, loads moved are up 45% and 28% month-over-month (m/m), respectively. On the same lanes, spot rates are up 3.5% and 4.5% m/m, respectively. In the combined Los Angeles and Ontario market, linehaul rates are $0.12/mile higher than last year as capacity tightens to levels last seen in October 2022. At $2.22/mile, outbound average dry van spot rates are just $0.10/mile lower than in 2020, $0.10/mile higher than last year, and just over $0.20/mile higher than in 2019.
Load-to-Truck Ratio
Dry van load post volume followed the post-July 4 fall in freight volumes on a short workweek, dropping by 49% w/w, slightly more than the average week-over-week change over the last eight years. Load post volumes are 15% lower than last year, while carrier equipment posts were 22% lower, decreasing the dry van load-to-truck ratio by 36% w/w to 3.57, 3% higher than last year.
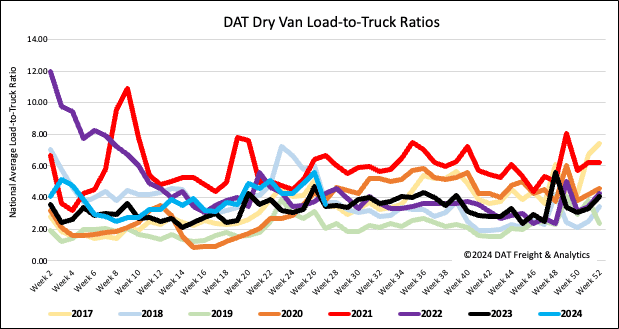
Linehaul spot rates
Last week, the national average dry van linehaul rate remained flat at $1.70/mile on a shortened workweek. Spot rates are almost identical to last year, and the eight-year average week-over-week change for the week of July 4. DAT’s Top 50 lanes, based on the volume of loads moved, increased by $0.06/mile, averaging $2.12/mile last week, which is $0.42/mile higher than the national average.