The 2023 INRIX Global Traffic Scorecard provides valuable insights, a crucial tool for understanding the ever-changing traffic patterns in large U.S. freight markets. It’s not just about traffic; it’s a barometer for the economy. The movement of people, goods, and services creates demand for road travel, and when this demand exceeds the supply of road space, congestion ensues. While traffic congestion may seem detrimental to the economy, it’s a symptom of economic activity.
Get the clearest, most accurate view of the truckload marketplace with data from DAT iQ.
Tune into DAT iQ Live, live on YouTube or LinkedIn, 10am ET every Tuesday.
One of the most significant changes for truckers making deliveries and pickups is the shift to the traditional AM/PM peak periods and the emergence of more traffic towards midday. When the pandemic first took hold, INRIX noted that demand for road travel in the U.S. was strong during the middle of the day. The 2023 research report highlighted that the data “shows that midday periods Monday through Saturday have more demand and perform more poorly than the traditional weekday morning commute periods.” This shift in traffic patterns has undoubtedly posed challenges for our hardworking truckers.
As a result, the average morning hourly commute trips are down about 12% in 2023 compared to 2019. The PM peak (3:00-6:00 PM) is down just 9%. However, average hourly traffic during the midday is up an astonishing 23%, a trend that has remained since 2020. In an earlier study, INRIX noted the importance of flatter peak periods. Using Atlanta as a case study, the study found that as morning traffic shifted to the afternoon, CO2e emissions dropped 15% from just an 8% reduction in demand and less vehicular delay.
Market watch
All rates cited below exclude fuel surcharges, and load volume refers to loads moved unless otherwise noted.
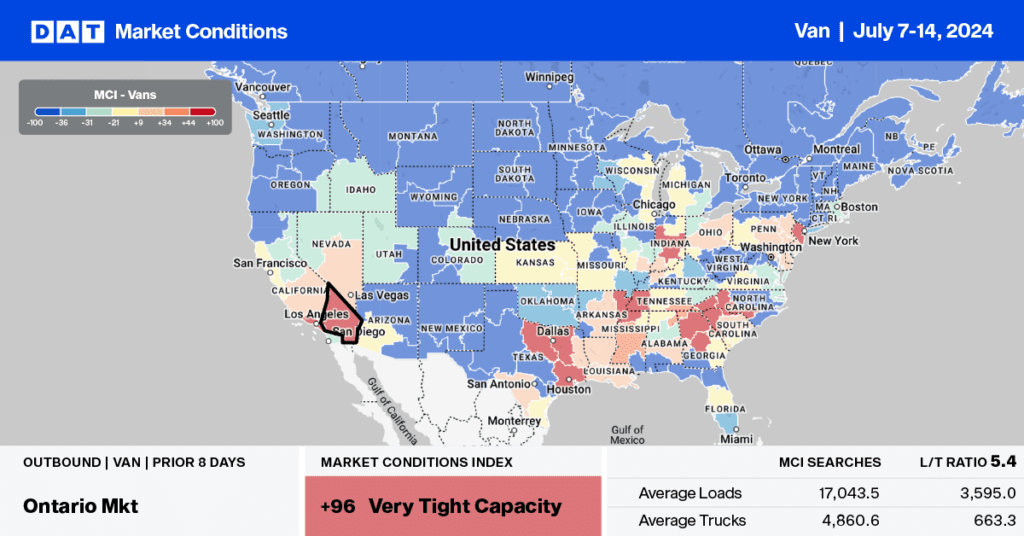
At $1.93/mile, outbound linehaul rates in Ohio are identical to last year following last week’s 5.3% increase in volume. In the larger Columbus market, spot rates were mostly flat even though there was a surge in volume, up 15% w/w. Most of the volume gains were reported on the regional lane west of Chicago, where volumes increased by 39% w/w while sufficient capacity kept linehaul rates flat at around $1.66/mile.
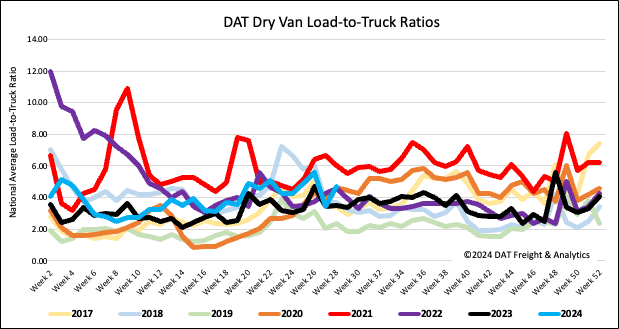
Load-to-Truck Ratio
The dry van load post volume surged last week as retail shopping took center stage during the back-to-school shopping season and Amazon Prime Day this week. Last week’s volumes were 7% higher than last year and almost identical to levels seen during the pandemic in 2020 and 2021. Carrier equipment posts were up 19% w/w but the lowest since 2017, resulting in the dry van load-to-truck ratio (LTR) increasing by 36% w/w to 4.71, the second-highest LTR since 2016, surpassed only by 2021.
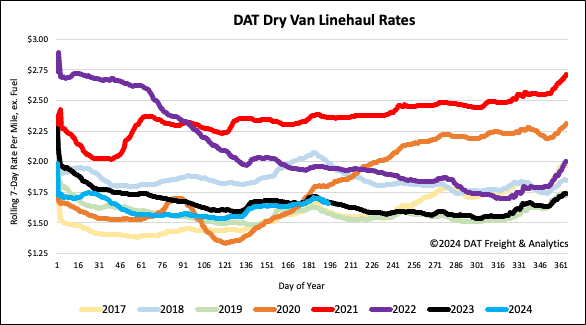
Linehaul spot rates
The level of excess capacity in the spot market was evident as dry van linehaul rates dropped by $0.03/mile on a 5% higher volume of loads moved last week. At $1.67/mile, the national average dry van linehaul rate was identical to last year, and the eight-year average week-over-week change for Week 28. DAT’s Top 50 lanes, based on the volume of loads moved, dropped by $0.04/mile to $2.08/mile, $0.41/mile higher than the national average.