According to the IHS Market/PIERS database, May containerized imports increased by 3% month-over-month (m/m) and 7% year-over-year (y/y). Totaling 2.3m TEU (twenty-foot equivalent units), May’s numbers were the highest since 2018, excluding the pandemic-influenced years 2021 and 2022. West Coast volumes were up 2% m/m but were dragged down by a 13% reduction in sequential volume in the Port of Los Angeles. In contrast, the Port of Long Beach reported a 13% m/m increase.
Get the clearest, most accurate view of the truckload marketplace with data from DAT iQ.
Tune into DAT iQ Live, live on YouTube or LinkedIn, 10am ET every Tuesday.
On the East Coast, the Port of New York and New Jersey reported an 8.3% m/m increase in volume, followed by Savannah, which reported a 9.4% m/m gain. Gulf Coast volumes continue to increase, up 14% m/m and 16% y/y, boosted by solid volumes in Houston, where TEU volume was up 17% m/m and 18% y/y. Imported furniture remains the number one import commodity at 12% of TEU volume, up 11% m/m and y/y. Imports from Northeast Asia, accounting for just half of all containerized imports in May, were up 7% m/m and 6% y/y.
Market watch
All rates cited below exclude fuel surcharges, and load volume refers to loads moved unless otherwise noted.
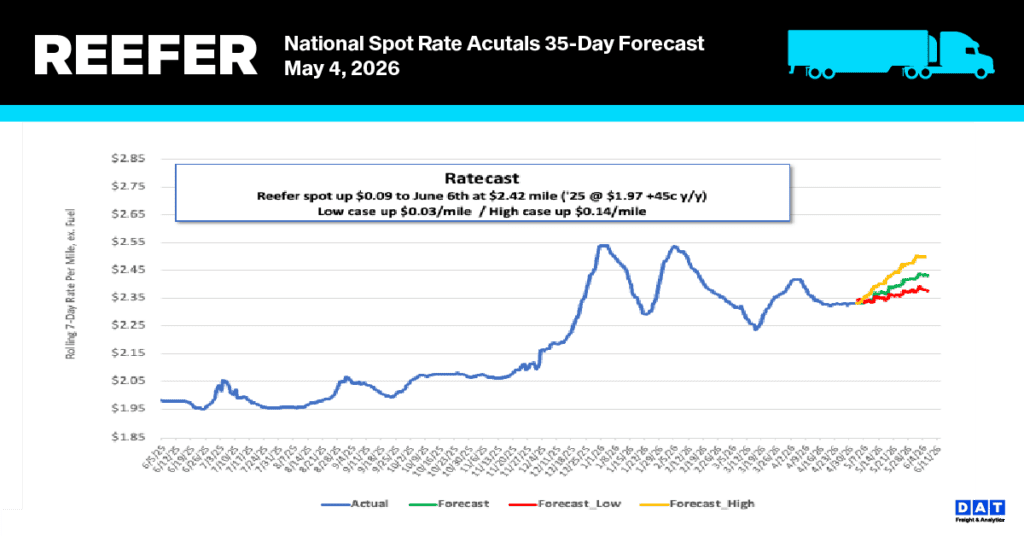
Available capacity on the regional lane between Atlanta and Orlando was much tighter last week, leading to an increase in spot rates by around $0.25/mile above the 12-month average. Reefer linehaul rates are $2.83/mile, $0.36/mile higher than last month, and $0.20/mile higher than last year. In Allentown, PA, regional loads to Boston are $0.10/mile higher than last year, averaging $3.24/mile last week, while loads from Harrisburg to Boston averaged $2.98/mile, $0.08/mile higher than last June.
In Texas, state-average outbound linehaul rates are around $0.10/mile lower than last year, and spot rates are mostly flat at $511/load from Dallas to Houston and $525/load on the return trip, equating to a $2.10/mile round-trip average of regional carriers dedicated to this lane.
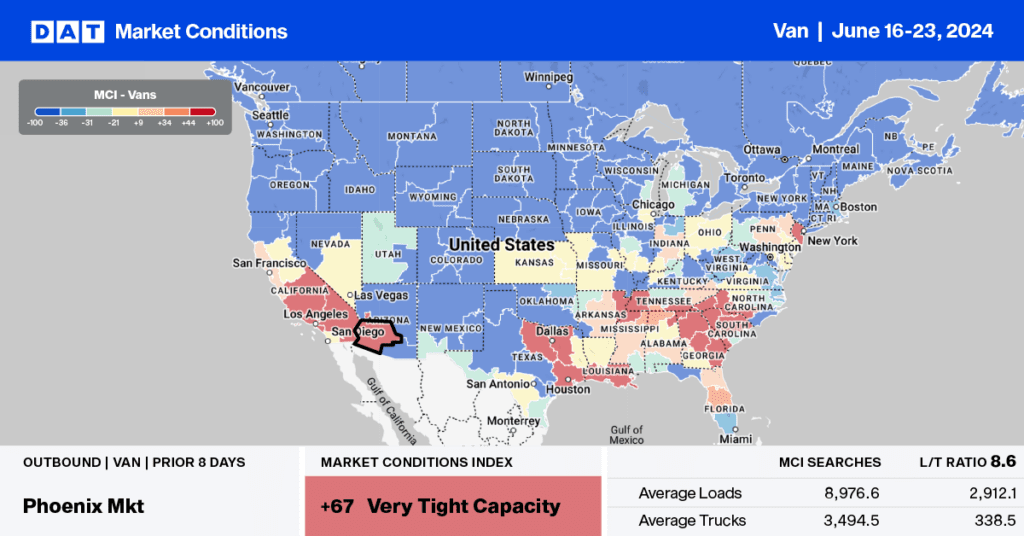
On the West Coast in Stockton, CA, inbound loads from Ontario were $0.30/mile higher than last month, averaging $2.84/mile last week and just over $0.20/mile higher than last year. Los Angeles to Stockton loads paid carriers an average of $2.85/mile, while loads east to Phoenix paid an average of $2.92/mile, $0.14/mile higher than last year.
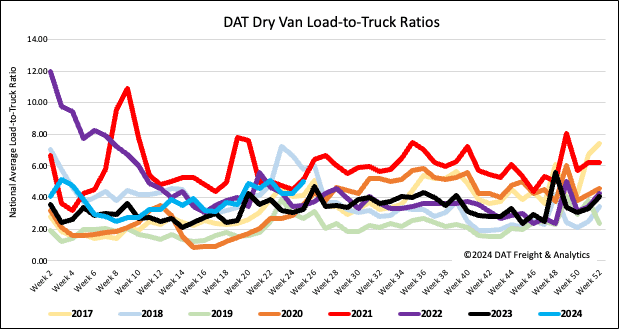
Load-to-Truck Ratio
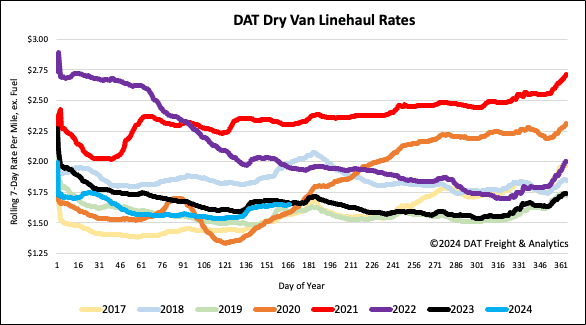
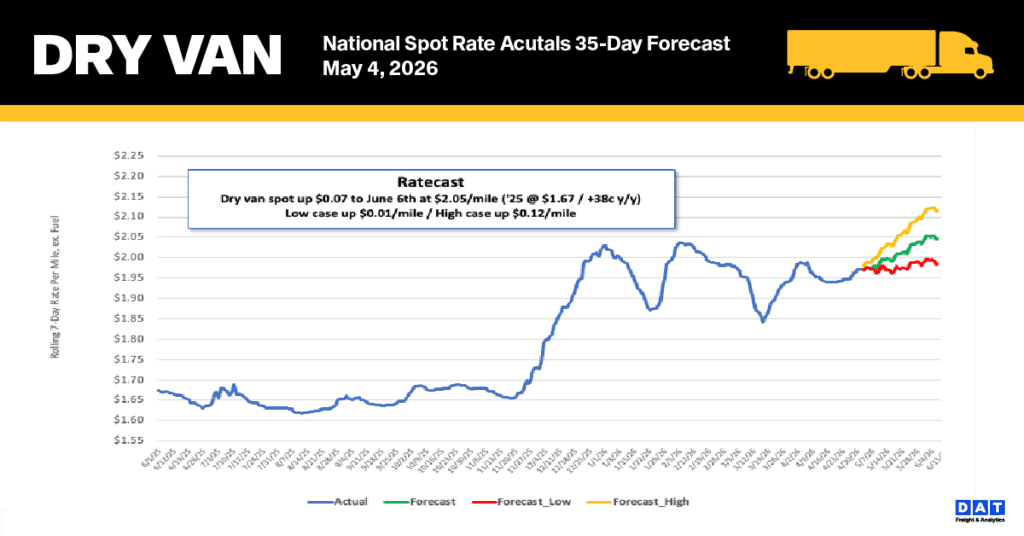
Dry van load post volume surged to the highest level since Week 25 in 2021, following last week’s 9% week-over-week (w/w) gain. Carrier equipment posts were 7% lower and the lowest since the start of April, increasing the dry van load-to-truck ratio by 18% w/w to 5.01.
Linehaul spot rates
After being mostly flat for three weeks, the national average dry van linehaul rate increased by almost $0.02/mile last week to $1.77/mile. Compared to last year, spot rates are identical on a 4% higher volume of spot market loads moved in Week 25. DAT’s Top 50 lanes, based on the volume of loads moved, averaged $2.03/mile last week, $0.26/mile higher than the national average.