Importers concerned about a possible East and Gulf Coast port worker strike and introduction of tariffs on imports being touted by the incoming Administration have already front-loaded a significant amount of fourth-quarter imports. Even though October’s containerized import volumes were down 5% month-over-month (m/m), they were almost 8% higher than last year. October’s total TEU (twenty-foot equivalent) volume was only 6,252 TEU (0.02%) lower than the October record set in 2020 at the peak of e-commerce retail shopping during the pandemic.
Get the clearest, most accurate view of the truckload marketplace with data from DAT iQ.
Tune into DAT iQ Live, live on YouTube or LinkedIn, 10am ET every Tuesday.
In an unusual turn of events, the Port of Long Beach beat out New York for second place behind the Port of Los Angeles for the highest number of TEU in October. The Ports of New York and New Jersey, where volumes were flat m/m and 4% lower than last year, are consistently the number two ports in the nation. Total East Coast volumes are around 9% higher than last year, while the West Coast reported October TEU volumes were 21% higher. Gulf Coast volumes were 6% lower than last year, impacted by Houston and Mobile, where volumes were 5% and 23% lower y/y.
Market watch
All rates cited below exclude fuel surcharges, and load volume refers to loads moved unless otherwise noted.
This week, we focus on the Los Angeles port market, where a record-high number of containers were imported for October in the Ports of Los Angeles and Long Beach. Containerized imports measured in twenty-foot equivalent units (TEU) were up 26.4% year over year last month, accounting for nearly 50% of national TEU volume. The number one commodity imported was furniture, up almost 30% year over year, accounting for 13% of import volume. Imports of menswear and footwear increased by 50% and 43% y/y, respectively.
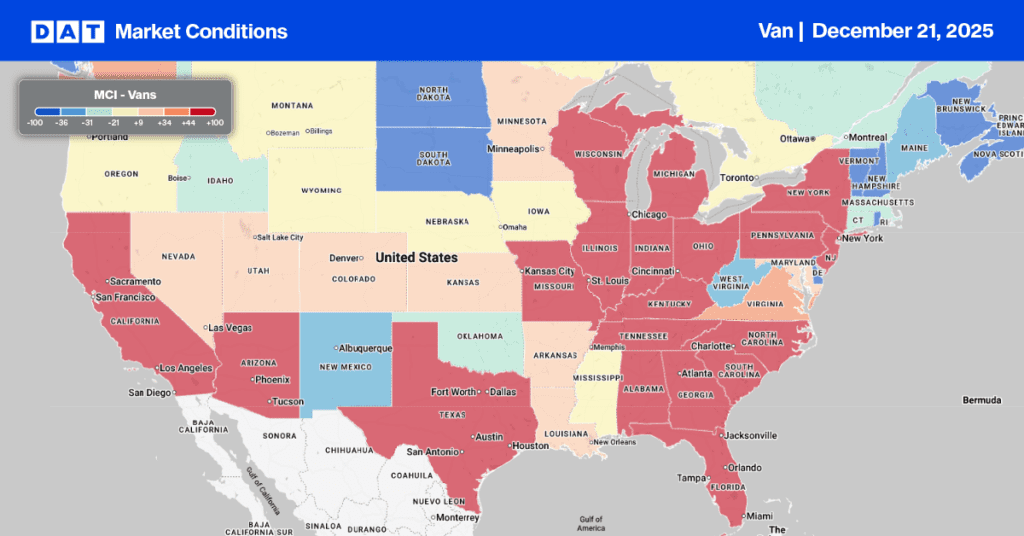
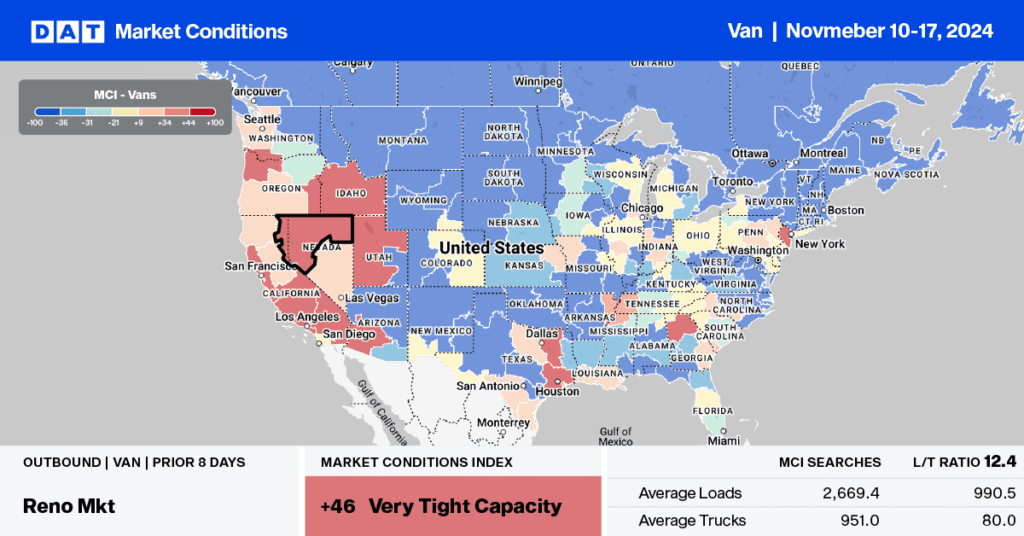
Higher import volumes have helped boost outbound truckload volumes, up 7% y/y in Los Angeles and 5% y/y in nearby Ontario. Outbound linehaul rates are also up 7% and 5%, paying carriers an average of $2.33/mile over the same timeframe. Truckload volumes on the high-volume e-commerce lane east to Phoenix are up 12% y/y, while spot rates are up 7% y/y ($0.19/mile), averaging $3.01/mile. Truckload capacity has been tight in Los Angeles for some time now, and according to DATs Market Condition Index (MCI), will remain tight well into next week.
Load-to-Truck Ratio
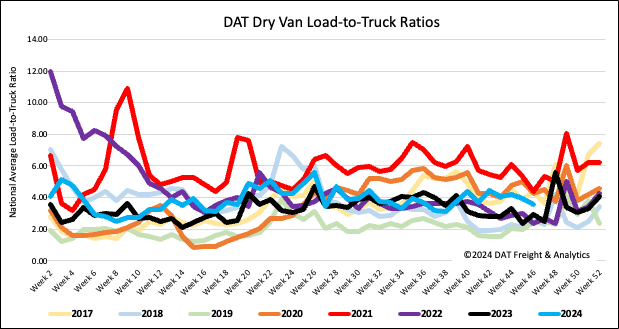
After four successive weeks of declines, the volume of dry van load posts is 4% lower than last year following last week’s 9% w/w decrease. Excluding the pandemic-affected years of 2021 and 2022, load posts for Week 46 are 8% lower than in previous years. Additionally, carrier capacity in the spot market was flat last week, resulting in an 8% decrease in the dry van load-to-truck ratio (LTR) to 3.59 last week.
Linehaul spot rates
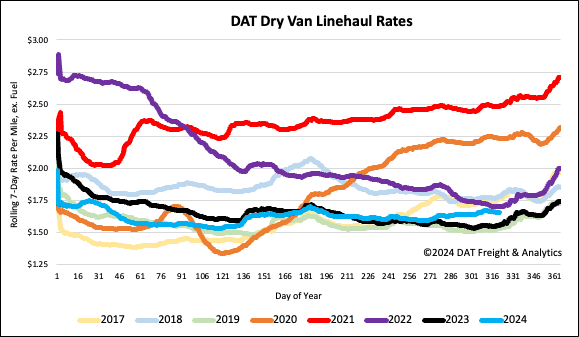
Even though the volume of loads moved increased by just under 1%, there was sufficient available capacity to meet demand, resulting in a penny-per-mile decrease in the national average dry van linehaul rates. At $1.66/mile, spot rates are $0.10/mile higher than last year and $0.04/mile lower than 2022. On DATs Top 50 lanes based on the volume of loads moved, carriers were paid an average of $1.98/mile, $0.32/mile higher than the national 7-day rolling average spot rates. Dry Van linehaul rates are around $0.03/mile higher than the three-month trailing average.
