Greater Phoenix is one of America’s longest-standing semiconductor hubs. Motorola started the region’s microelectronics boom when it opened a research and development facility in Phoenix in 1949. Now, seven decades later, Greater Phoenix has a thriving and diverse ecosystem that is home to research and development, manufacturing, and headquarters facilities for some of the industry’s most well-known companies, including Intel, Microchip, NXP, OnSemi, and most recently, TSMC. Between them, they employ almost 20,000 people.
Get the clearest, most accurate view of the truckload marketplace with data from DAT iQ.
Tune into DAT iQ Live, live on YouTube or LinkedIn, 10am ET every Tuesday.
In April 2024, the U.S. Department of Commerce and TSMC Arizona announced up to US$6.6 billion in direct funding under the CHIPS and Science Act, fulfilling a goal to bring the most advanced chip manufacturing in the world to the United States. TSMC also announced plans to build a third semiconductor fabrication plant (commonly called a fab) at TSMC Arizona. This third fab brings TSMC’s total U.S. investment to more than $65 billion, making this the most significant foreign direct investment (FDI) in Arizona’s history and the largest FDI in a greenfield project in U.S. history, covering over 1,100 acres.
Market watch
All rates cited below exclude fuel surcharges, and load volume refers to loads moved unless otherwise noted.
This week, we focus on the Phoenix freight market, where outbound truckload capacity is expected to be moderately tight in the coming week. Phoenix is a large inbound freight market and growing distribution market due to the surge in commercial warehouse growth in recent years, especially imported containerized cargo. Inbound freight volumes are expected to continue rising as importers front-load imports to avoid any adverse impacts of additional tariffs that could be implemented when the new Administration begins.
Even though Inbound truckload volumes have decreased by 26% in the last month, they are up 17% compared to this time a year ago. Inbound spot rates are up 13% or $0.13/mile over the same timeframe. On the high-volume lane from Los Angeles and Ontario, volumes are up 31% y/y while dry van spot rates are 16% or $0.45/mile higher, averaging $3.22/mile to start 2025.

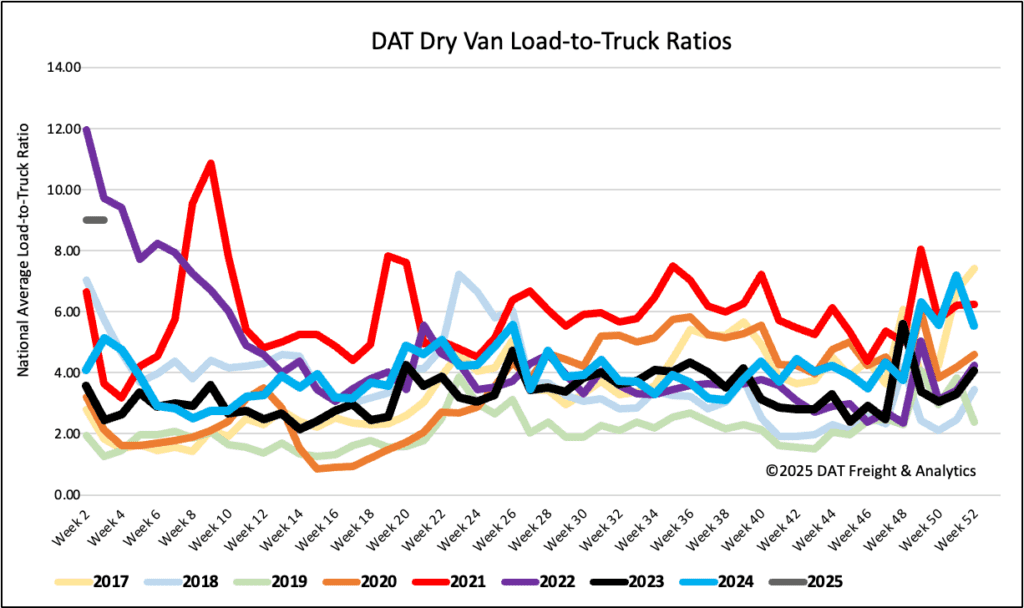
Load-to-Truck Ratio
With New Year’s Day falling on a Wednesday this year, last week was a two-day shipping week, making sequential and year-over-year comparisons ineffective. New Year’s Day fell on a Monday the prior two years, making the start of those years bigger shipping weeks. Still, load and equipment post-daily averages were consistent with Week 1 activity in prior years. As a result, last week’s dry van load-to-truck ratio (LTR) started off 2025 at 9.02.
Linehaul spot rates
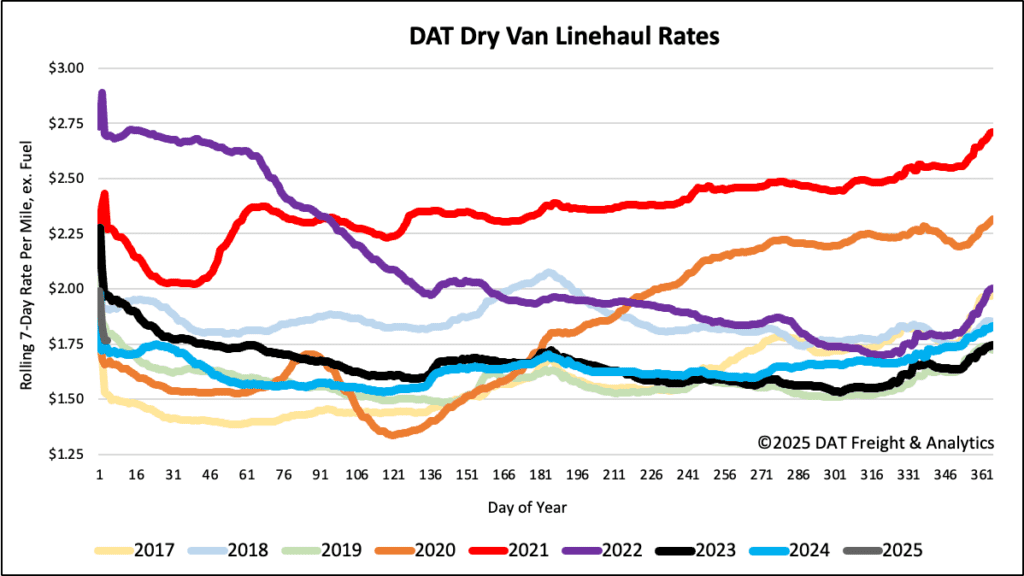
The national average dry van linehaul rate ended last week at $1.80/mile, down a penny-per-mile from the prior short week during the Christmas break. At $1.80/mile, spot rates are $0.03/mile (2%) higher than last year. On DATs’ Top 50 lanes, based on the volume of loads moved, carriers were paid an average of $2.20/mile, $0.40/mile higher than the national 7-day rolling average spot rate.
